Video Tutorials

The program consists of 600+ columns covering all possible data for all stocks/currency pairs. For ease and speed, the visible data is grouped into five toggleable sections:
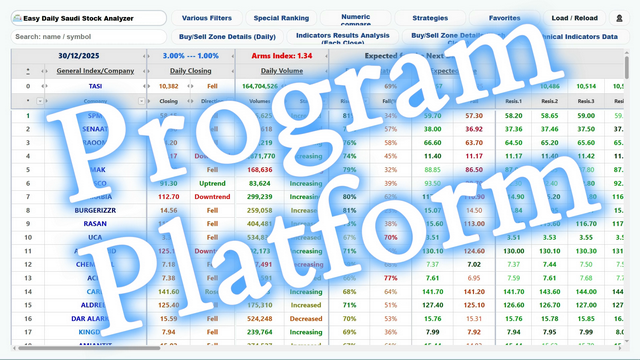
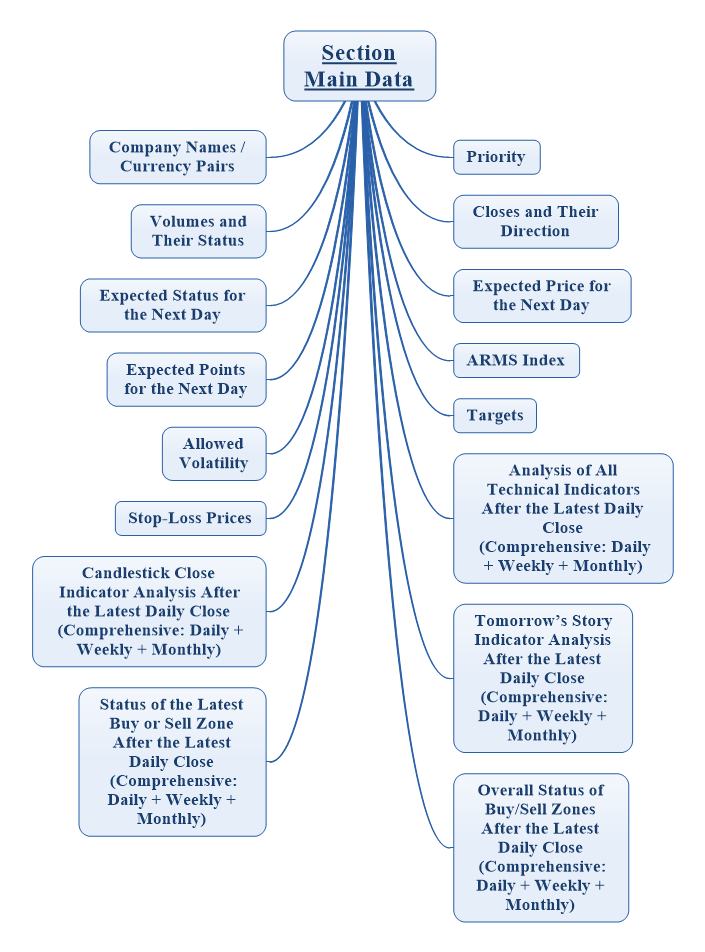
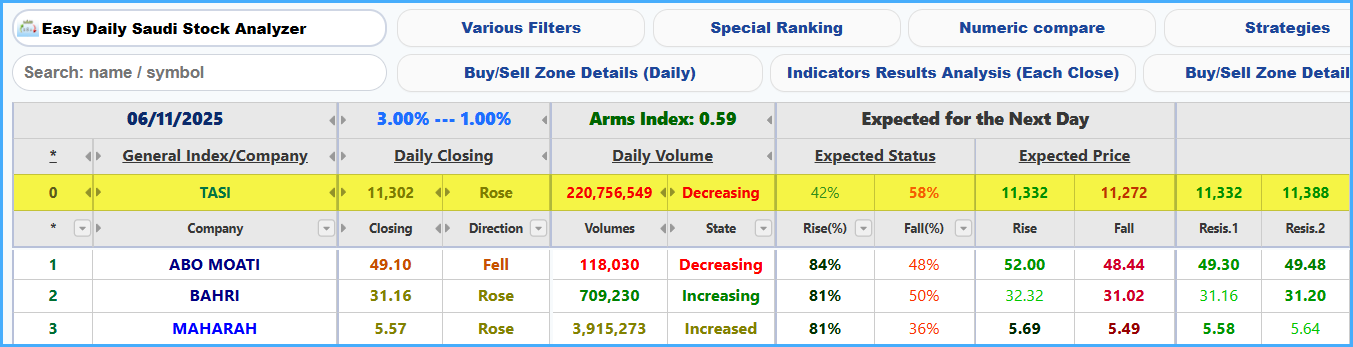
(1) Main Data Section
Everything a trader needs for the next trading day: a technical ranking of stocks/pairs, next-day expected states, daily/weekly/monthly results, expected prices, targets (supports/resistances merged with Fibonacci), the aggregated indicators result, Tomorrow’s Story indicator, Candle-Close indicator, plus the general buy/sell zones status and the last zone for each period.
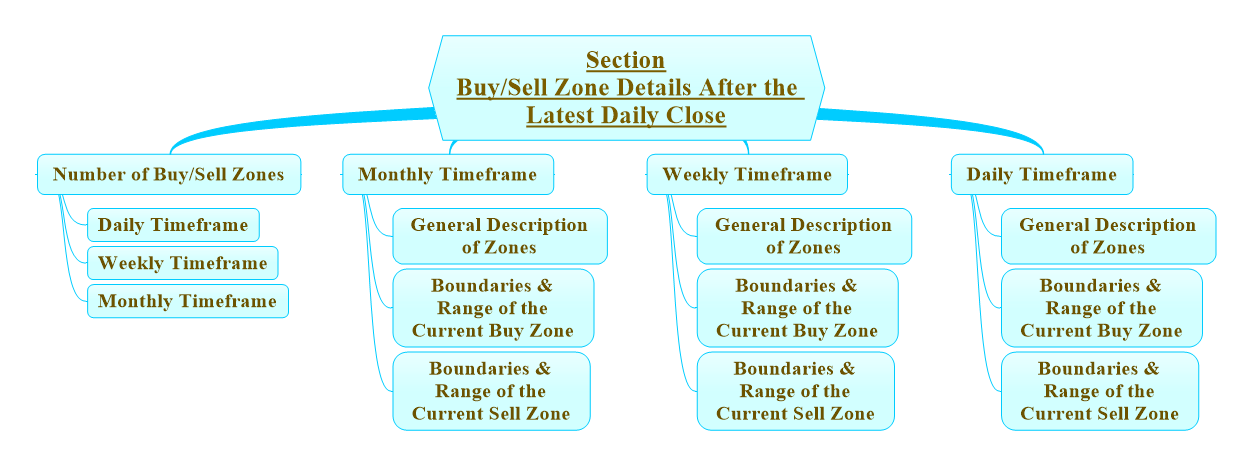
(2) Buy/Sell Zones Details after the Last Daily Close
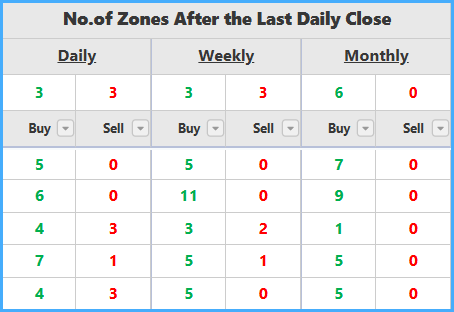
Shows a general description, bounds, and magnitude of the current zones for daily/weekly/monthly after the last daily close, as well as the total number of buy/sell zones over the last 200 periods. Toggles with the “Buy/Sell Zones Details (Today)” button.
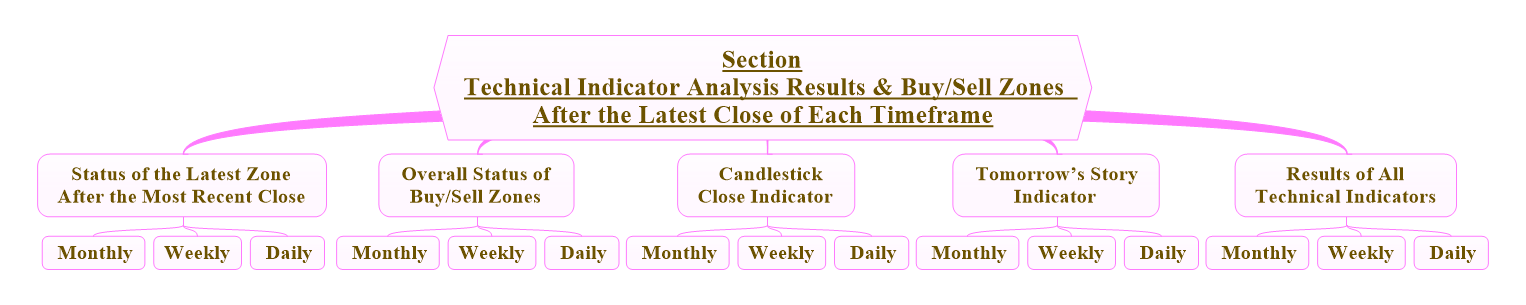
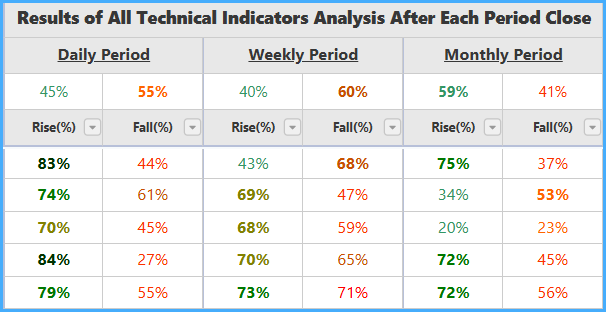
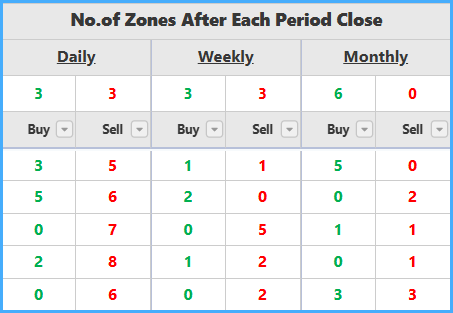
(3) Indicators & Zones after Each Period Close
Shows the technical indicators result, Tomorrow’s Story indicator, and Candle-Close indicator for daily/weekly/monthly after each period close; also includes the general buy/sell zones status and the last zone per period. Toggles with “Indicators Analysis Results (by Periods)”.
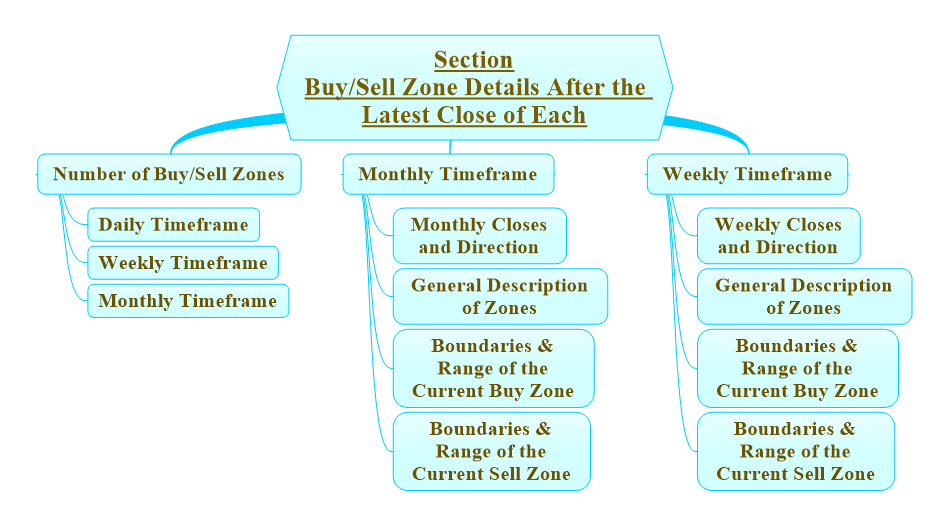
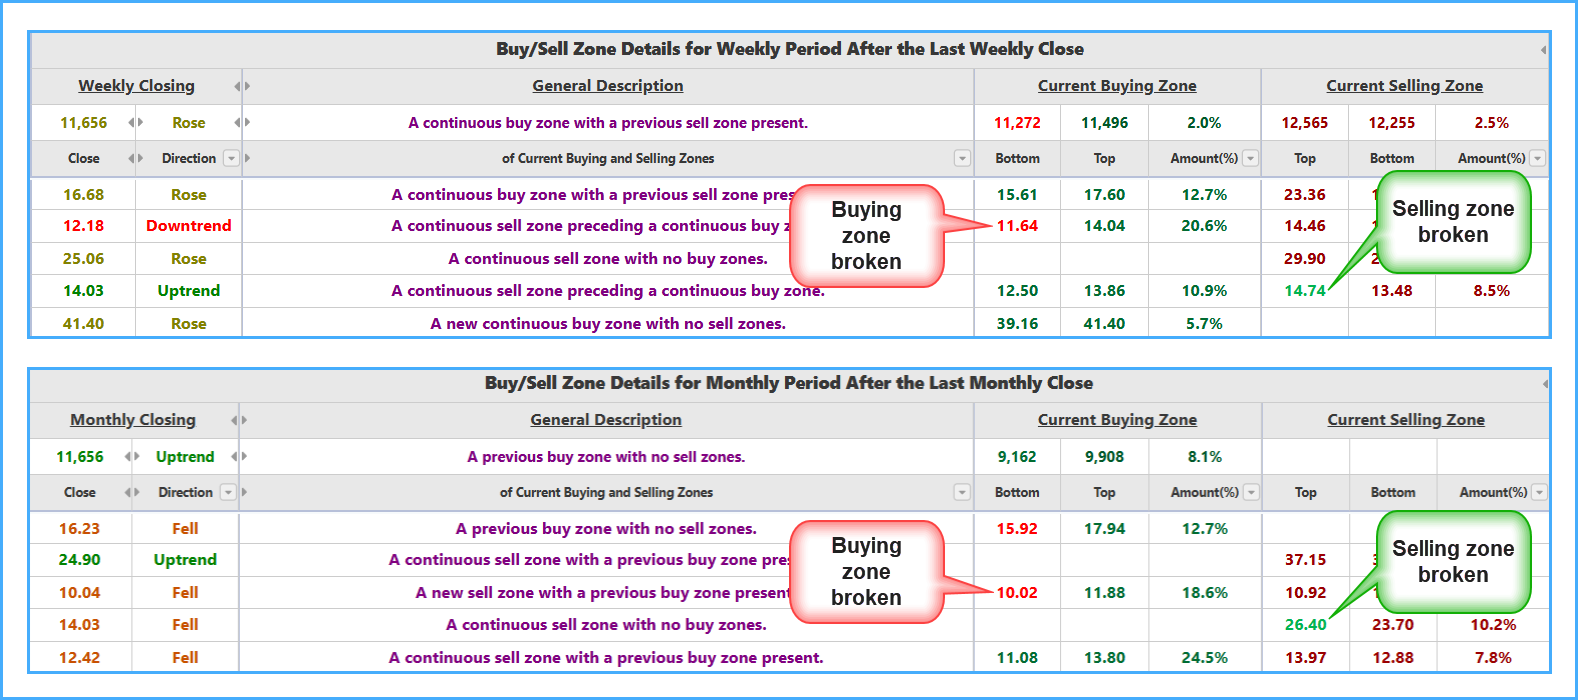
(4) Zones Details after Each Period Close (Weekly/Monthly)
Detailed description, bounds, and magnitude of the current zones for weekly and monthly, with the weekly/monthly closes and their state, plus totals for the last 200 periods. Toggles with “Zones Details (Week/Month)”.
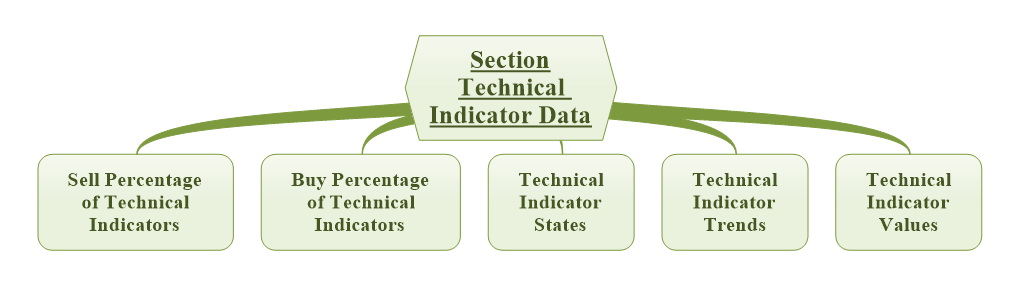
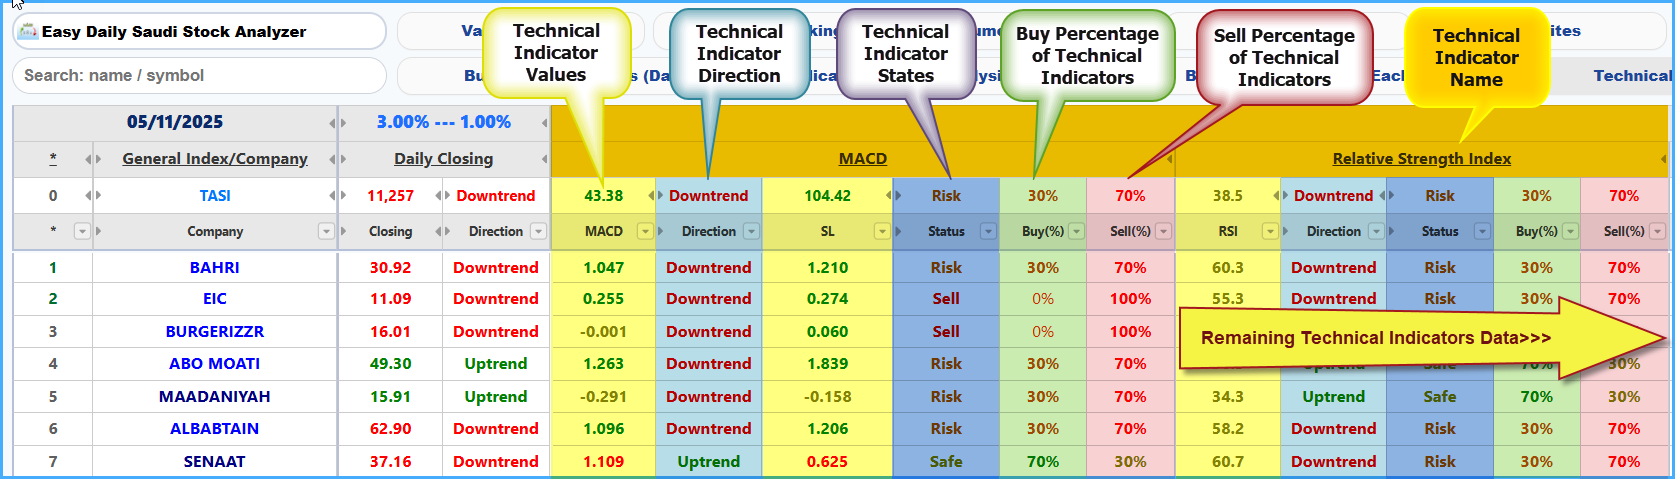
(5) Technical Indicators Data
Values, directions, states, and sell/buy percentages for 40+ indicators for all stocks/pairs (daily period). Toggles with “Indicators Data”.
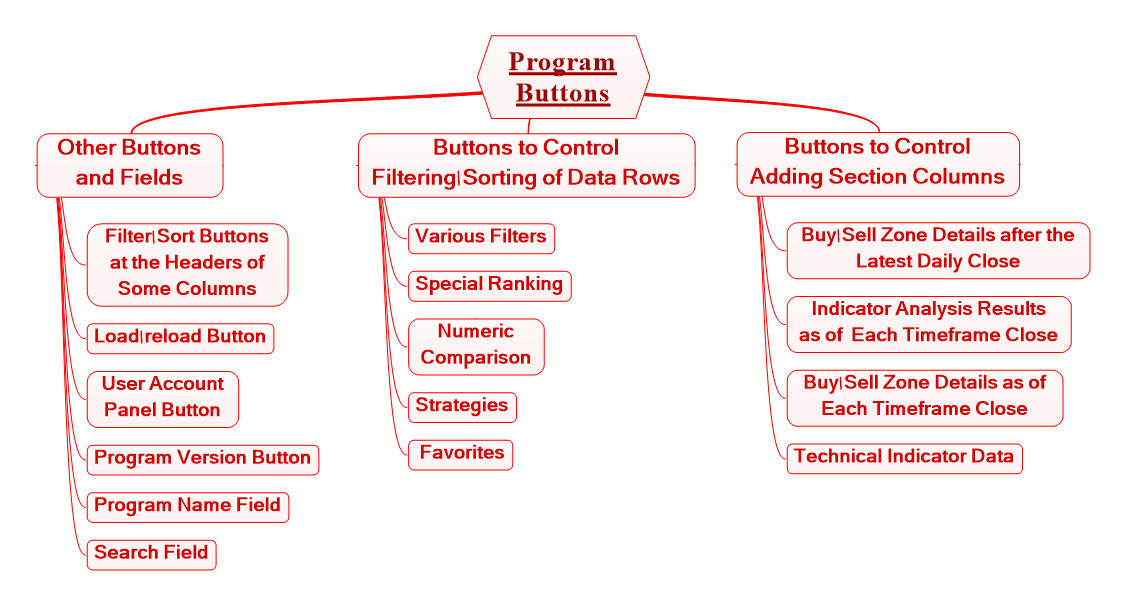
Program Buttons & Icons (Overview)
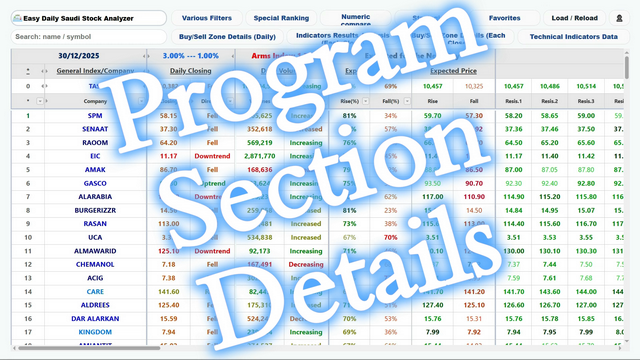
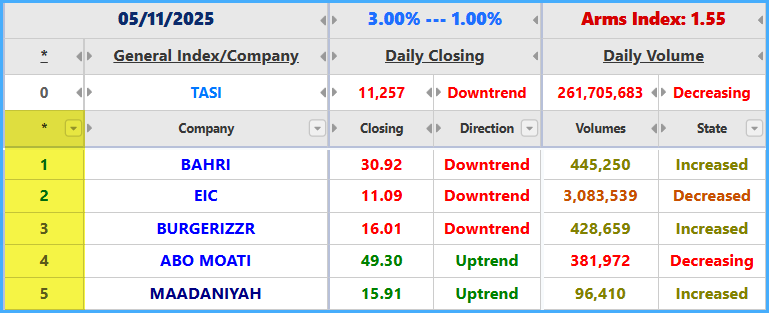
Details of the Main Data Section
Last Update Date
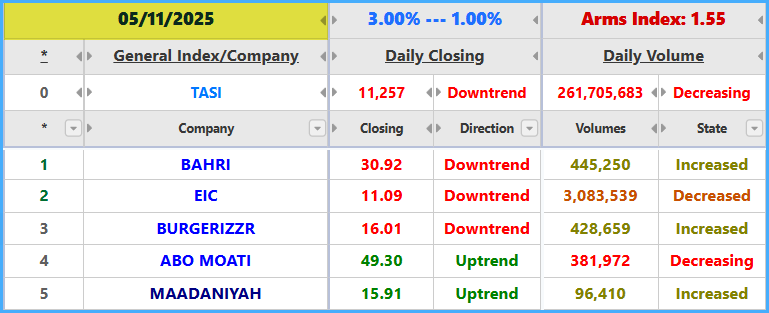
Stock markets are updated at least five hours after the end of trading to run historical studies and numeric reads across periods. Forex is updated at 00:00 GMT. Timing may vary based on the number of symbols and the availability of daily data.
Lower/Upper Percentages for Rise & Drop
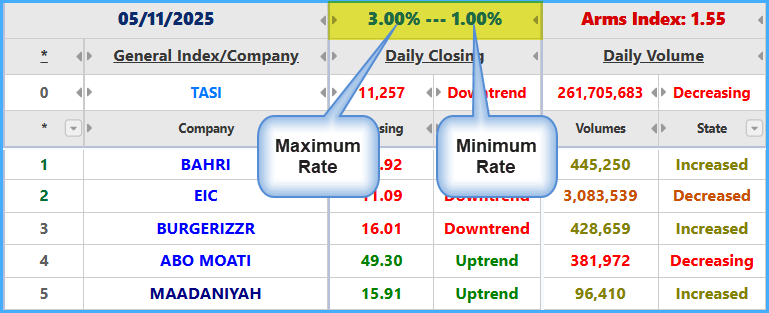
A market-aware volatility gauge (auto-set by the program) that affects the color of company/pair names. It is computed from average price volatility and differs per market and period.
General Index & Company/Pair Name
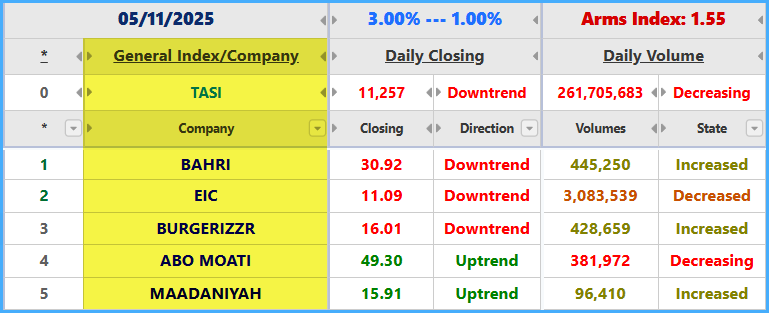
Name color reflects the expected rise percentage strength:
Light Blue: ≤ lower percentage.
Blue: > lower and < upper percentage.
Dark Blue: > upper and < 2× upper.
Black: ≥ 2× upper.
* No “General Index” row in Forex versions.
Preference (Ranking)
A serial ranking based on 10+ criteria (own indicators, other symbols’ indicators, the general index for stock markets,
and historical period analysis).
Colors:
Light Green: in “Bullish Favorites”.
Dark Green: in “Best Bullish”.
Light Red: in “Bearish Favorites”.
Dark Red: in “Best Bearish”.
Gray: not in any list.
Close
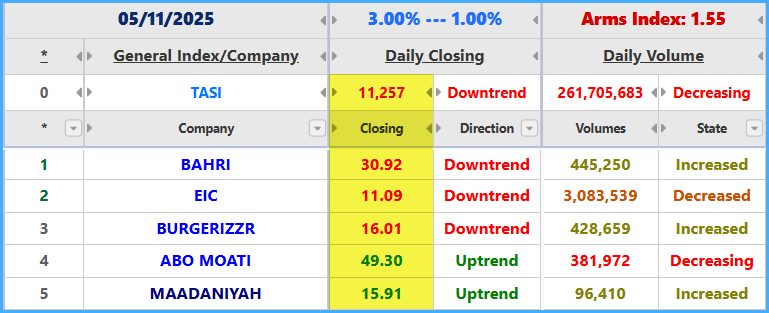
Olive: rose vs. previous day. | Green: still rising vs. last two days.
Light Brown: fell vs. previous day. | Red: still falling vs. last two days.
Black: unchanged vs. previous day.
Direction
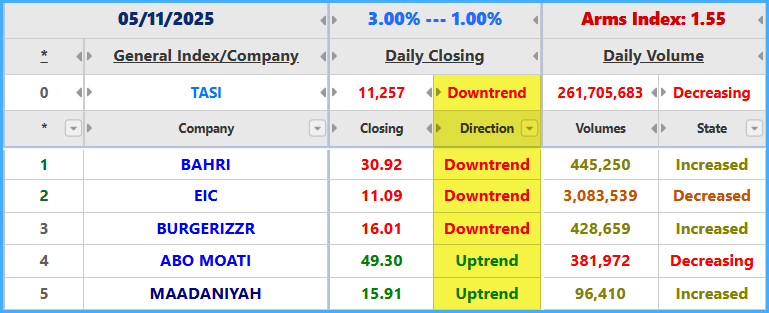
Up (Olive), Rising (Green), Down (Light Brown), Falling (Red), Unchanged (Black).
* Columns (Preference, Name, Daily Close) are pinned in all versions.
Volumes
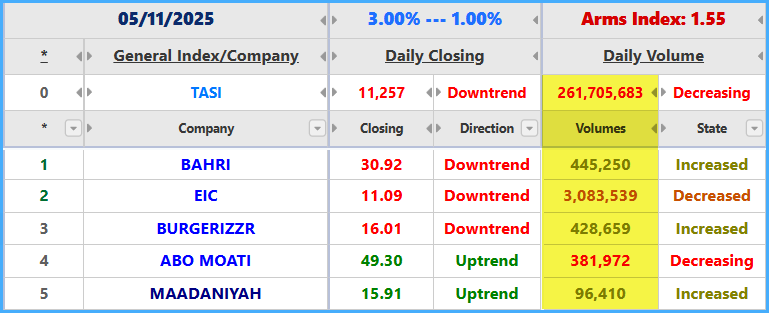
Olive: increased vs. previous day. | Green: still increasing vs. last two days.
Light Brown: decreased vs. previous day. | Red: still decreasing vs. last two days.
Black: unchanged vs. previous day.
* Not available in Forex versions.
Volumes State
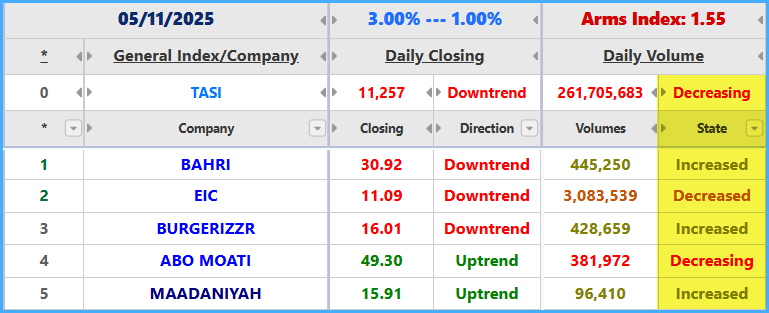
Increased (Olive), Increasing (Green), Decreased (Light Brown), Decreasing (Red), Unchanged (Black).
* Not available in Forex versions.
ARMS INDEX
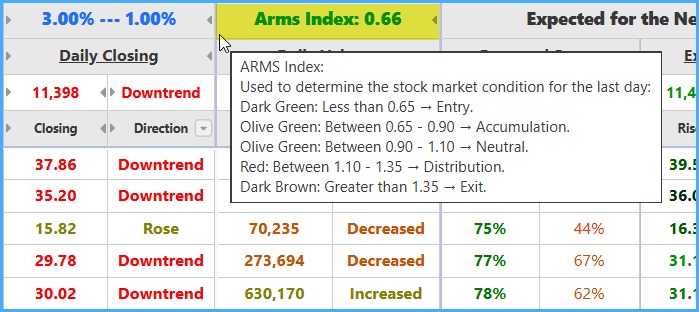
< 0.65: Entry (Dark Green). | 0.65–0.90: Accumulation (Olive). | 0.90–1.10: Neutral (Olive).
1.10–1.35: Distribution (Red). | > 1.35: Exit (Dark Brown).
* Not available in Forex versions.
Expected State for the Next Day
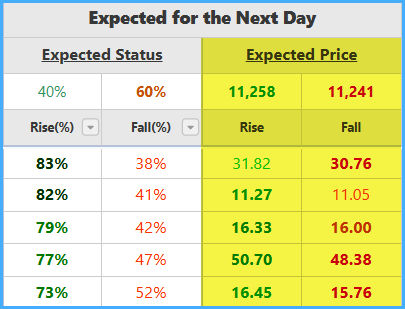
Percentages of expected rise and drop based on active indicators (combined with weekly/monthly results). They vary and don’t have to sum to 100%. Strength depends heavily on the rank (top ranks are stronger).
Rise: Dark Green > 80% | Green > 70% | Olive > 60% | Light Green < 60% | Wide Light Green: rise > drop
Drop: Maroon > 80% | Red > 70% | Light Brown > 60% | Orange < 60% | Wide Orange: drop > rise
If indicators are incomplete, a (–) is shown in rise/drop cells.
Expected Price for the Next Day
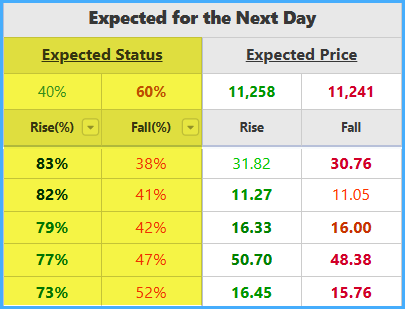
Closest price to targets (computed/historical/Fibonacci/EMA-based supports & resistances) derived from the averaged numeric analysis.
Rise (Resistances): darker = stronger: Wide Light Green (easy), Light Green (easier), Green (harder), Dark Green (strong).
Drop (Supports): darker = stronger: Wide Orange (easy), Orange (easier), Red (harder), Maroon (strong).
Expected Pips for the Next Day (Forex)
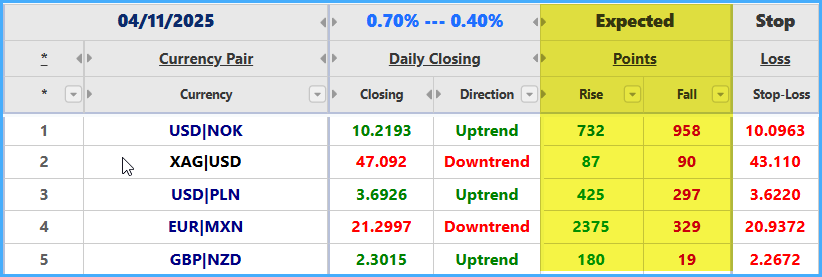
Expected pips based on expected prices. Color gradations reflect ease/difficulty to surpass (rise) or break (drop), same as above.
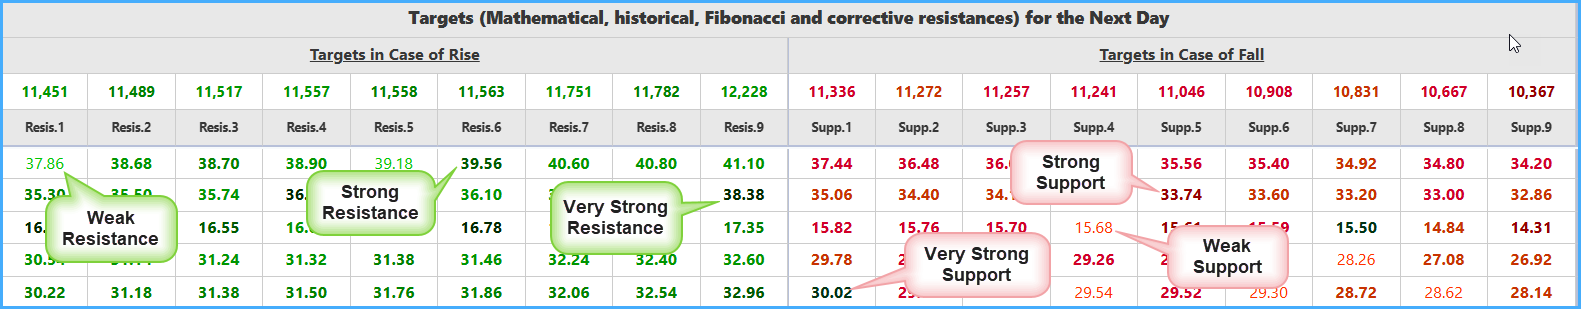
Targets (Supports/Resistances)
Top nine points for both support and resistance (computed/historical/corrective/Fibonacci/EMAs), including weekly and monthly. Reds/Browns for supports; Greens for resistances. Darker = stronger.
Allowed Intraday Fluctuation (Next Day)
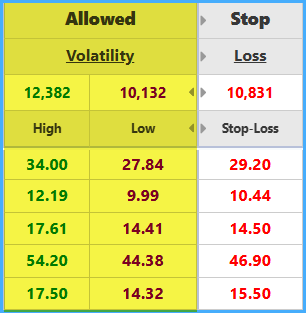
Maximum reachable bounds for the next day: High (Green) and Low (Purple).
* Not available in some versions.
Stop-Loss Prices
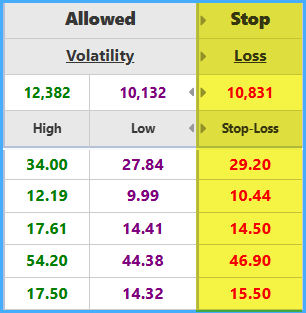
Strong supports inferred numerically during trading.
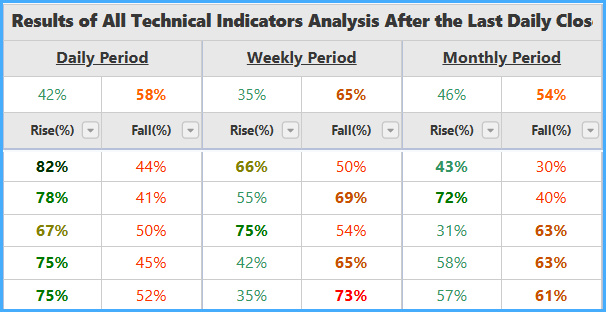
Indicators Result after the Last Daily Close
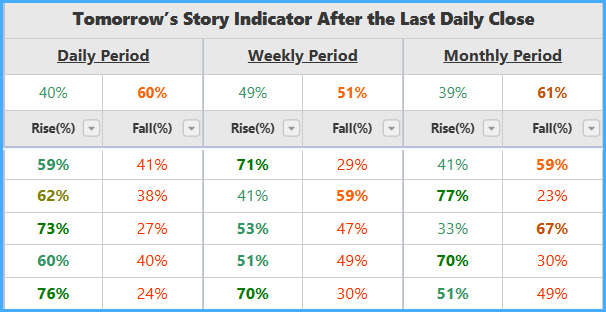
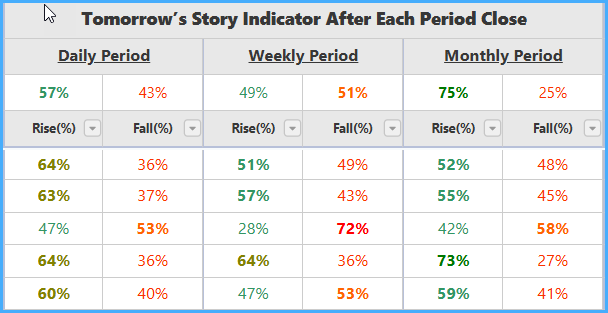
Tomorrow’s Story Indicator after the Last Daily Close
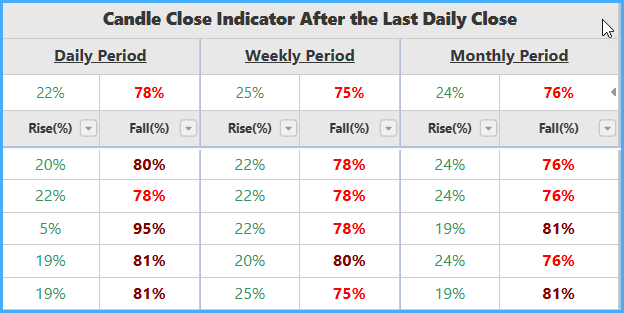
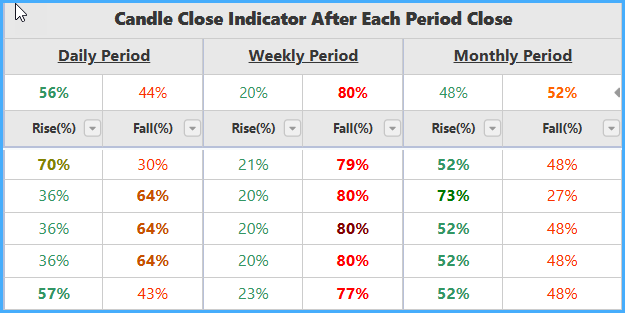
Candle-Close Indicator after the Last Daily Close
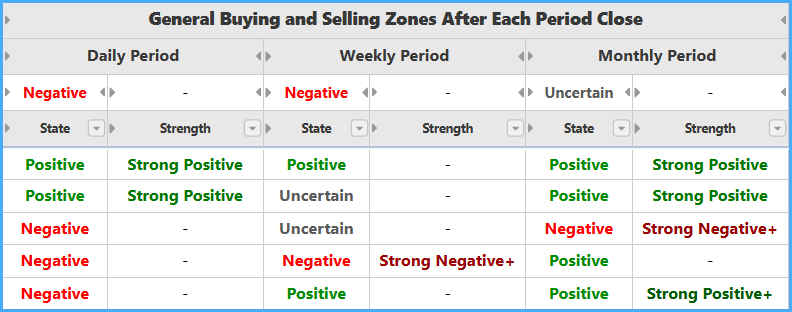
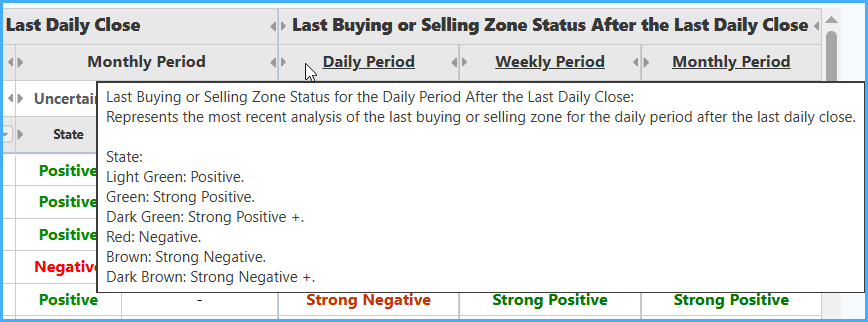
General Buy/Sell Zones after the Last Daily Close
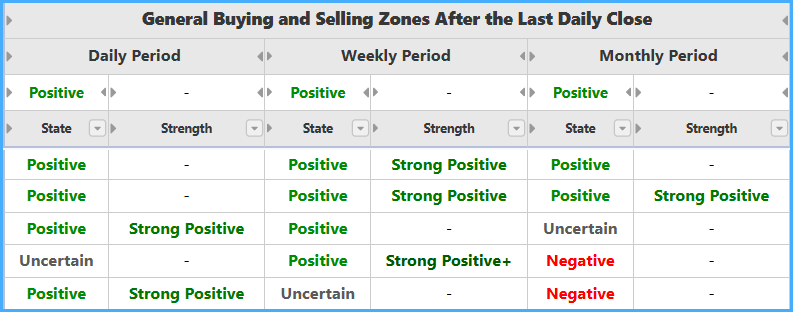
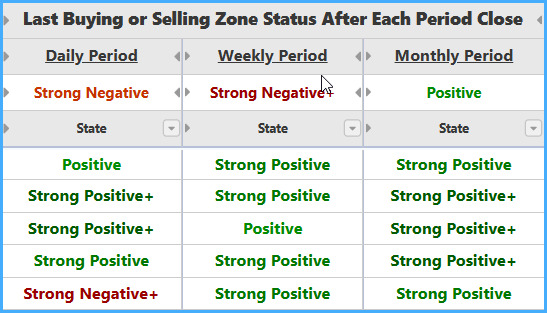
Last Zone Status (after the Last Daily Close)
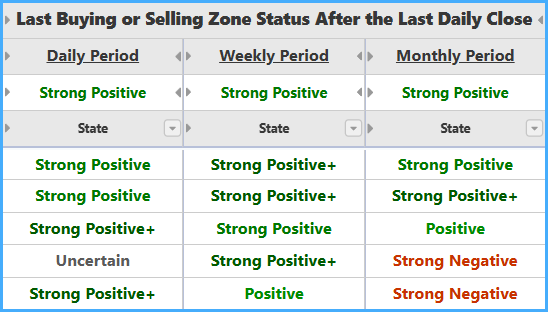
Details of Buy/Sell Zones after the Last Daily Close
For each period (daily/weekly/monthly): general description, low/high, and zone magnitude.
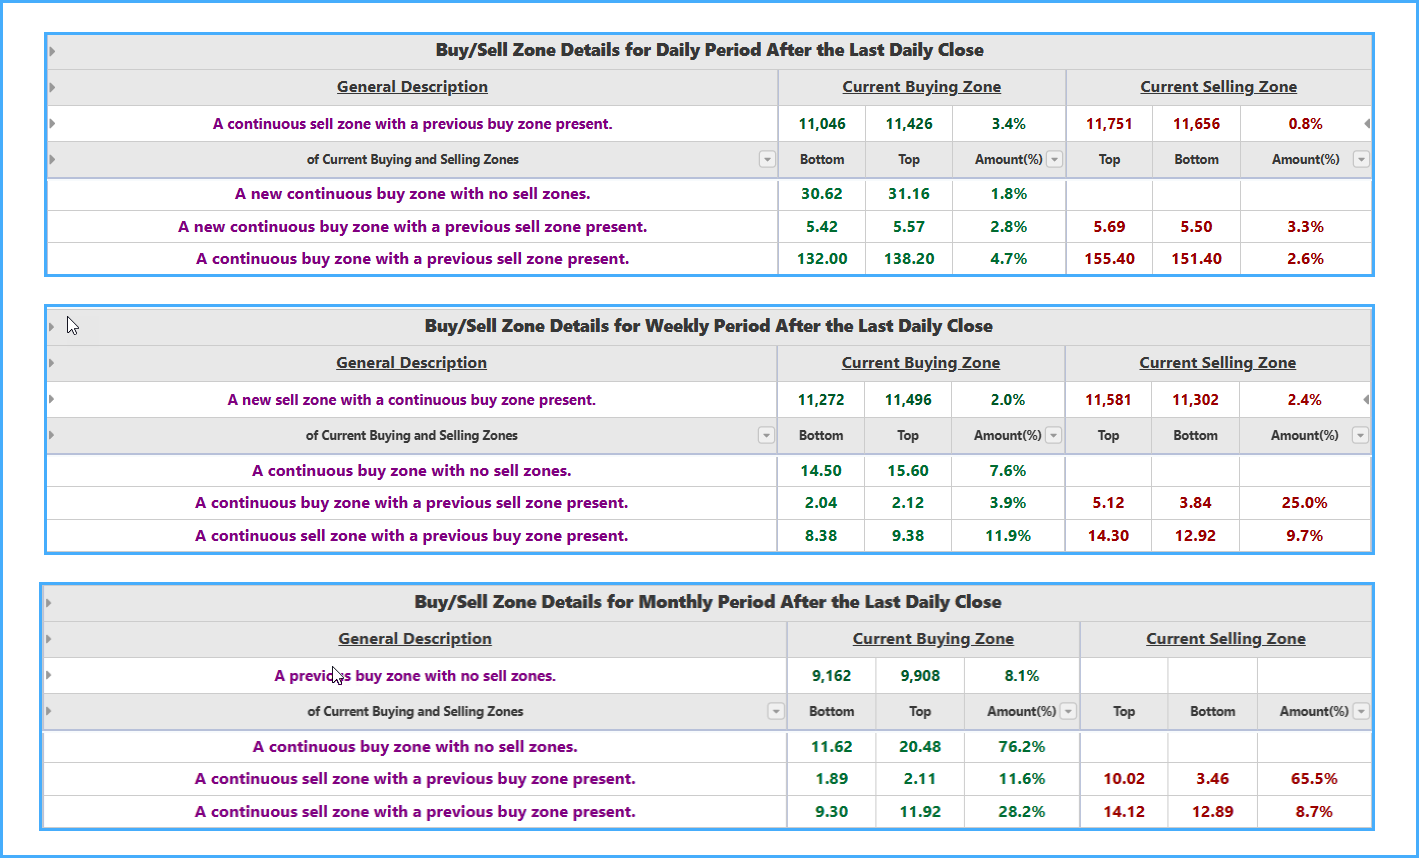
General Zone Descriptions
- Broke the last Sell zone; no Buy zones exist.
- Broke the last Sell zone; previous Sell zone exists; no Buy zones.
- New Sell zone (continuation); no Buy zones.
- New Sell zone; no Buy zones.
- Previous Sell zone; no Buy zones.
- Ongoing Sell zone; no Buy zones.
- Broke the last Buy zone; no Sell zones.
- New Sell zone (continuation) with a break of the last Buy zone.
- New Sell zone with a break of the last Buy zone.
- Broke the last Buy zone and a previous Sell zone exists.
- Broke the last Buy zone and an ongoing Sell zone exists.
- Broke the last Buy zone and a previous Buy zone exists; no Sell zones.
- New Sell (continuation) with break of last Buy + previous Buy zone exists.
- New Sell with break of last Buy + previous Buy zone exists.
- Broke last Buy; previous Buy exists + ongoing Sell exists.
- New Buy (continuation); no Sell zones.
- New Buy (continuation) with break of last Sell.
- New Buy (continuation) with break of last Sell + previous Sell exists.
- New Buy (continuation) + previous Sell exists.
- New Buy (continuation) + ongoing Sell exists.
- New Buy; no Sell zones.
- New Buy with break of last Sell.
- New Buy with break of last Sell + previous Sell exists.
- New Buy + previous Sell exists.
- New Buy + ongoing Sell exists.
- Previous Buy; no Sell zones.
- Broke the last Sell zone + previous Buy exists.
- New Sell (continuation) + previous Buy exists.
- New Sell + previous Buy exists.
- Ongoing Sell + previous Buy exists.
- Ongoing Buy; no Sell zones.
- Broke last Sell + ongoing Buy exists.
- Broke last Sell + previous Sell exists + ongoing Buy exists.
- New Sell (continuation) + ongoing Buy exists.
- New Sell + ongoing Buy exists.
- Ongoing Buy + previous Sell exists.
- Broke last Buy zone + previous Buy precedes previous Sell.
- Broke last Buy zone + previous Sell precedes previous Buy.
- Broke last Sell zone + previous Buy precedes previous Sell.
- Broke last Sell zone + previous Sell precedes previous Buy.
- Previous Buy precedes previous Sell.
- Previous Sell precedes previous Buy.
- Ongoing Buy precedes ongoing Sell.
- Ongoing Sell precedes ongoing Buy.
- No clear zones after breaking the last Buy zone.
- No clear zones after breaking the last Sell zone.
- No clear zones.
Indicators & Zones after Each Period Close — Details
Shows results after the last weekly/monthly close, and repeats daily for easier comparison.
Weekly/Monthly Close & Direction
Olive: rose vs. previous period. | Green: still rising vs. last two periods.
Light Brown: fell vs. previous period. | Red: still falling vs. last two periods.
Black: unchanged vs. previous period.
General Zone Descriptions (Weekly/Monthly)
Same detailed list above applies to weekly and monthly periods.
Note: In the “Current Buy/Sell Zone” section, text turns Red if the current Buy zone’s low is broken after the last daily close, and Green if the current Sell zone’s high is broken after the last daily close.
Zones Details after Each Period Close
For weekly and monthly: close price & state, general description, and the current zones’ low/high and magnitude.
Technical Indicators Data — Details
For each indicator: name, value, direction, state, and sell/buy percentage for all stocks/pairs (daily). Colors: Reds/Browns = risky/sell; Greens/Olives = safe/buy; Blue/Black = indecisive/ignored.
Program Buttons & Icons (Detailed)
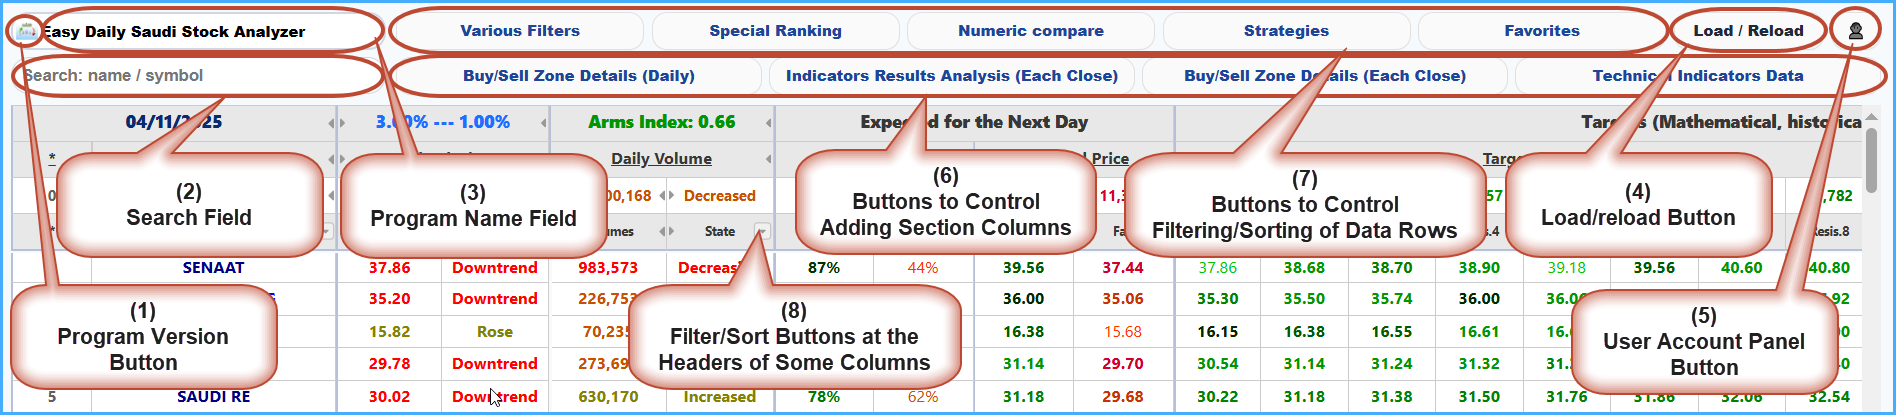
(1) Show Current Version

(2) Search Box
Search by company/pair name or symbol.
(3) Program/Market Name Field
(4) Reload & Re-initialize
Reloads and re-formats data without re-logging.
(5) Show User Window
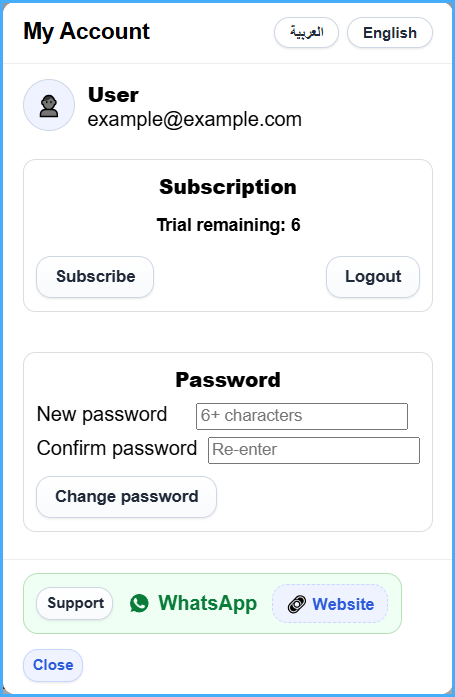
(6) Toggle Program Sections
- Buy/Sell Zones Details (Today)
- Indicators Analysis Results (by Periods)
- Zones Details (Week/Month)
- Indicators Data
The button color changes when its section is shown.
(7) Filtering & Ranking Controls
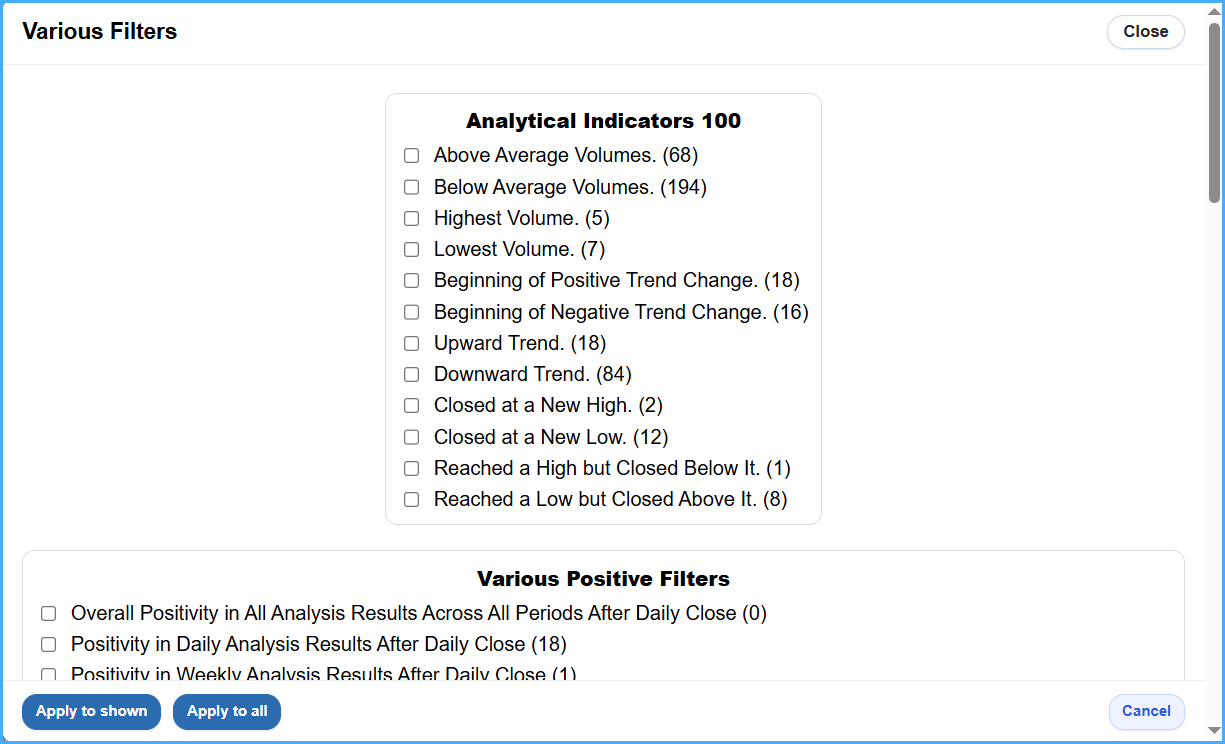
“100 Trading-Days Metrics” Presets
- Above average volume. (xxx)
- Below average volume. (xxx)
- Highest volume. (xxx)
- Lowest volume. (xxx)
- Start turning bullish. (xxx)
- Start turning bearish. (xxx)
- Uptrend. (xxx)
- Downtrend. (xxx)
- Close at a new high. (xxx)
- Close at a new low. (xxx)
- Hit a high then closed below it. (xxx)
- Hit a low then closed above it. (xxx)
* (xxx) shows the count of matching symbols.
Positive Filters
- Positive across all results for all periods after daily close. (xxx)
- Positive across daily period after daily close. (xxx)
- Positive across weekly period after daily close. (xxx)
- Positive across monthly period after daily close. (xxx)
- Positive across all indicators for all periods after daily close. (xxx)
- Positive by Tomorrow’s Story & Candle-Close across all periods after daily close. (xxx)
- Positive by buy/sell zones across all periods after daily close. (xxx)
- Strong/Strong+ positivity by zones power in any period after daily close. (xxx)
- Positive across weekly after weekly close. (xxx)
- Positive by indicators + Tomorrow’s Story + Candle-Close (weekly after weekly close). (xxx)
- Positive by zones (weekly after weekly close). (xxx)
- Strong/Strong+ positivity by zones (weekly after weekly close). (xxx)
- Positive across monthly after monthly close. (xxx)
- Positive by indicators + Tomorrow’s Story + Candle-Close (monthly after monthly close). (xxx)
- Positive by zones (monthly after monthly close). (xxx)
- Strong/Strong+ positivity by zones (monthly after monthly close). (xxx)
* (xxx) shows the count of matching symbols.
Negative Filters
- Negative across all results for all periods after daily close. (xxx)
- Negative across daily period after daily close. (xxx)
- Negative across weekly period after daily close. (xxx)
- Negative across monthly period after daily close. (xxx)
- Negative across all indicators for all periods after daily close. (xxx)
- Negative by Tomorrow’s Story & Candle-Close across all periods after daily close. (xxx)
- Negative by buy/sell zones across all periods after daily close. (xxx)
- Strong/Strong+ negativity by zones power in any period after daily close. (xxx)
- Weekly negatives after weekly close (results/indicators/zones). (xxx)
- Monthly negatives after monthly close (results/indicators/zones). (xxx)
- Strong/Strong+ negatives by zones for weekly/monthly. (xxx)
* (xxx) shows the count of matching symbols.
Other Mixed Filters
- Volume above 3-day average. (xxx)
- Broke any current/previous buy/sell zone in any period after last daily/weekly/monthly close. (xxx)
- Broke previous Sell (daily). (xxx) — Broke previous Buy (daily). (xxx)
- Inside/Above current Buy (daily). (xxx) — Inside/Below current Sell (daily). (xxx)
- Break/Inside/Above/Below current zones (weekly, after last daily close). (xxx)
- Break/Inside/Above/Below current zones (monthly, after last daily close). (xxx)
- Broke previous/current zones on weekly after last weekly close. (xxx)
- Broke previous/current zones on monthly after last monthly close. (xxx)
* More presets are added automatically once proven useful.
Special Ranking
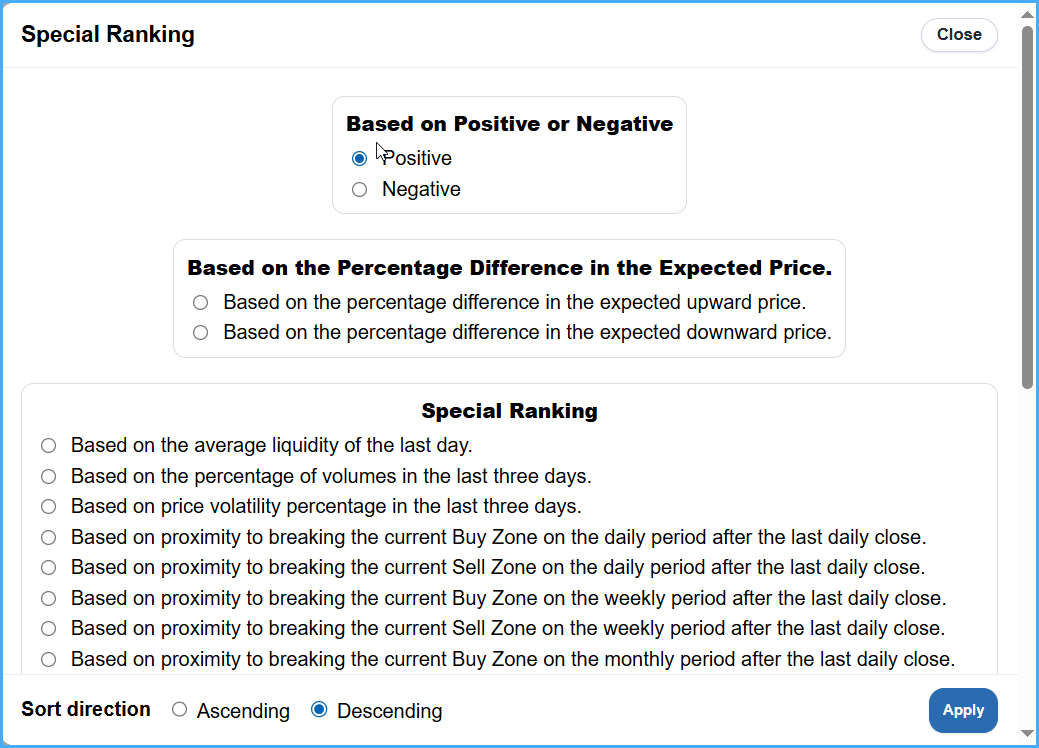
Powerful ascending/descending ranking options across the whole dataset under three main groups:
Rank by Positivity/Negativity
Positive: ranks by strength of rise and positive indicator results.
Negative: ranks by strength of drop and negative indicator results.
Rank by Expected Price Difference (%)
- By % difference in expected rise price.
- By % difference in expected drop price.
Custom Ranking
- By last-day liquidity average.
- By 3-day volumes ratio.
- By 3-day price volatility ratio.
- By closeness to breaking current zones on daily/weekly/monthly after last closes.
- Positive → Negative (daily/weekly/monthly/all) and vice versa.
- Bullish/Bearish ranks by weekly/monthly analysis after daily/weekly/monthly closes.
* Options expand automatically when proven useful.
Numeric Compare
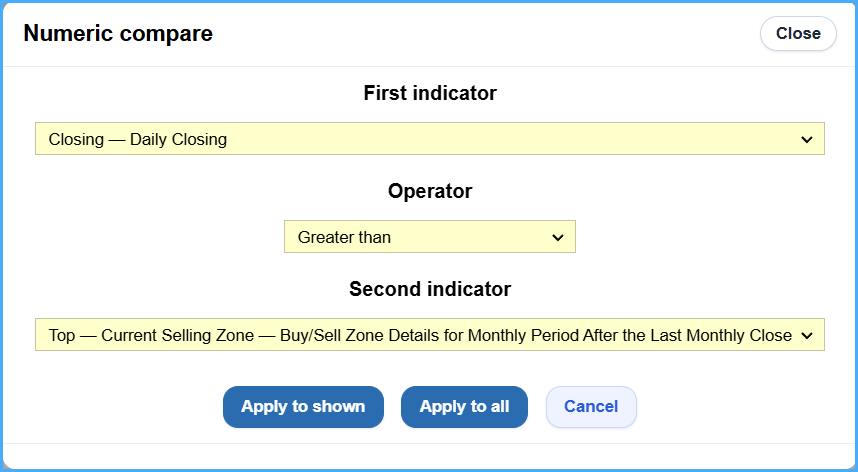
Compare comparable numeric fields across the program, e.g.:
- Close − Daily Close
- Low/High − current Buy/Sell (daily/weekly/monthly) after last closes
- Close − Weekly/Monthly Close
- Indicator values: Bollinger (UP/MID/DOWN), Price Channel (Upper/Buttom), DEMA/TEMA, EMA 5/9/13/15/26/50/100, PSAR, LRI, UPB/LPB, UB/LB, TSF
Strategies
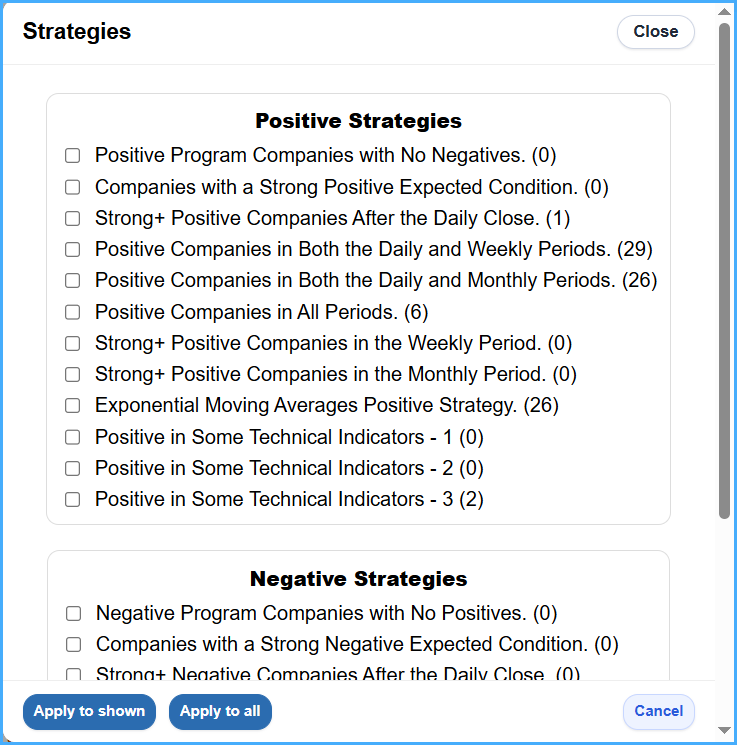
Positive/Negative strategy filters curated to surface the most relevant symbols. Selecting a strategy shows a short description; counts (xxx) show how many symbols currently match.
Positive Strategies
- Positive symbols with no negatives. (xxx)
- Strong positive expected state. (xxx)
- Strong+ after daily close. (xxx)
- Positive in daily & weekly. (xxx)
- Positive in daily & monthly. (xxx)
- Positive across all periods. (xxx)
- Strong+ in weekly. (xxx)
- Strong+ in monthly. (xxx)
- Positive EMAs strategy. (xxx)
- Positive in some indicators (1/2/3). (xxx)
Negative Strategies
- Negative symbols with no positives. (xxx)
- Strong negative expected state. (xxx)
- Strong+ after daily close. (xxx)
- Negative in daily & weekly. (xxx)
- Negative in daily & monthly. (xxx)
- Negative across all periods. (xxx)
- Strong+ in weekly. (xxx)
- Strong+ in monthly. (xxx)
- Negative EMAs strategy. (xxx)
* Strategies expand automatically after validation.
Favorites
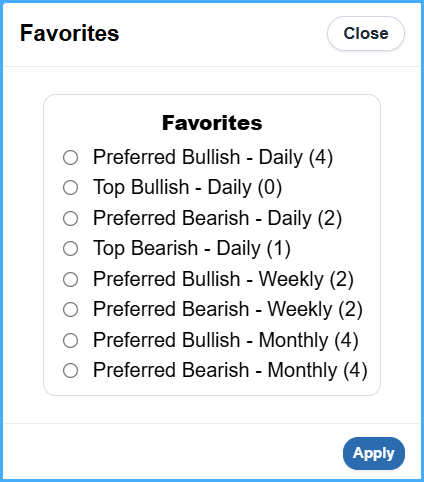
Lists of stocks/pairs most qualified for rise (positive) or drop (negative) based on strict conditions:
- Preferred Bullish - Daily (xx): Positive with strong alignment across some results for Daily Period.
- Top Bullish - Daily (xx): Safer/most qualified to rise; strong alignment across all results for Daily Period.
- Preferred Bearish - Daily (xx): Negative with strong alignment across some results for Daily Period.
- Top Bearish - Daily (xx): Riskier/most qualified to drop; strong alignment across all results for Daily Period.
- Preferred Bullish - Weekly (xx): Positive with strong alignment across some results for Weekly Period After the Last Weekly Close.
- Preferred Bearish - Weekly (xx): Negative with strong alignment across some results for Weekly Period After the Last Weekly Close.
- Preferred Bullish - Monthly (xx): Positive with strong alignment across some results for Monthly Period After the Last Monthly Close.
- Preferred Bearish - Monthly (xx): Negative with strong alignment across some results for Monthly Period After the Last Monthly Close.
* Favorites expand automatically after validation.
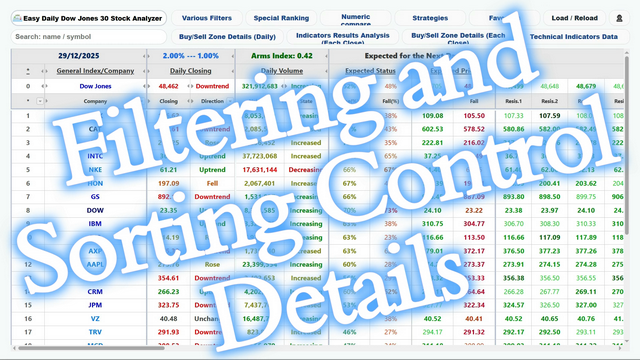
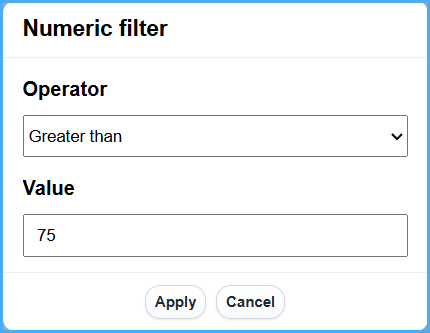
(8) Column-Head Filters & Sorting
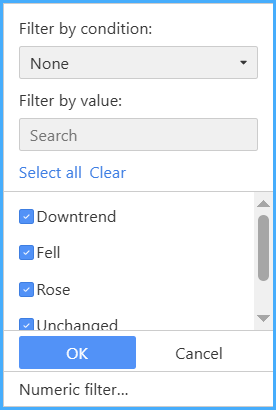
Opens a per-column filter window; includes a numeric quick-filter for that column.
General Index Row is Always First
* No index row in Forex versions.
Header Tooltips
Most columns show helpful tooltips when hovering the header.