

Analysis and Technical Indicator Details Page
Analysis and Technical Indicator Details Page
This page appears when the user taps the “Details” button on the stock/currency page or card. It contains all app information for the selected stock/currency, including numerical values, directions, states, buy and sell percentages for each technical indicator in the app, the analysis results of all active indicators for the daily, weekly, and monthly periods, the Tomorrow’s Story indicator for the daily, weekly, and monthly periods, and the Candle-Close indicator for the daily, weekly, and monthly periods. It also shows the Buy/Sell Zones, their strength for the daily, weekly, and monthly periods, in addition to the rest of the stock/currency information that appears on the other app pages.
The page contains the following:
(1) Market Name:
Shows the name of the market selected from the app’s main entry screen.
(2) Update Date:
Shows the program data update date, which is the date of the latest trading day. The program results shown on this date are intended to be used for the next trading day. For stock markets, program data is updated after the end of trading, over a period of no less than five hours, during which historical computer examinations and numerical readings are performed for all periods after adding the new day’s trading data. For the currency-market version of the program, the update is performed at 00:00 GMT at the end of each trading day. The update time may increase or decrease slightly depending on the number of companies in each market, the availability of daily trading data, and especially if any correction or modification is required.
(3) Stock/Currency Number and Name:
This is the stock/currency whose current information is being displayed. The stock/currency number is the same serial number shown on the Stock/Currency List page. The font color of the stock/currency name uses blue-to-black shades, where the color indicates the expected price-rise amount. The darker the color, the greater the expected rise price after the automated technical-analysis process.
The font color in the stock/currency number field indicates the following:
- Light green: when the company/currency pair belongs to the “Preferred Bullish” companies/currency-pairs list.
- Dark green: when the company/currency pair belongs to the “Best Bullish” companies/currency-pairs list.
- Light red: when the company/currency pair belongs to the “Preferred Bearish” companies/currency-pairs list.
- Dark red: when the company/currency pair belongs to the “Best Bearish” companies/currency-pairs list.
- Gray: when the company/currency pair does not belong to any list.
(4) Search Icon:
Used to search all information headings on the page.
(5) Information:
It contains all information related to the stock/currency as follows:
First,
Main Data, including the following:
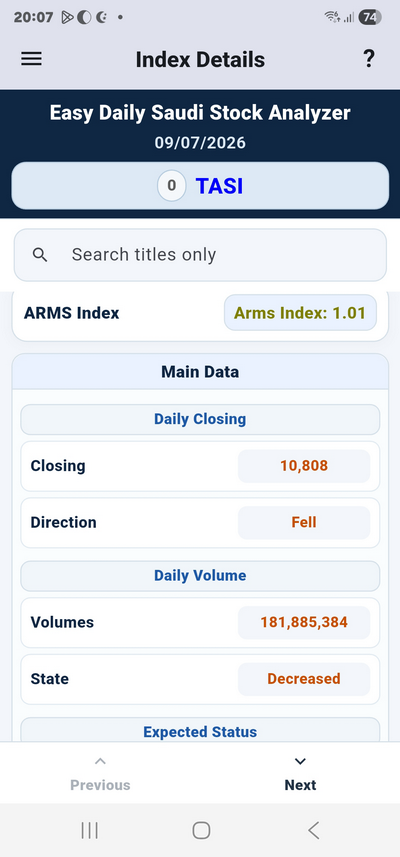
(5.1) ARMS INDEX:
Used to identify the latest market condition, and it appears only for the general index in stock markets:
- Dark green: below 0.65 ... Entry.
- Olive: between 0.65 and 0.90 ... Accumulation.
- Olive: between 0.90 and 1.10 ... Normal.
- Red: between 1.10 and 1.35 ... Distribution.
- Dark brown: greater than 1.35 ... Exit.
- Dark brown: the value (---) is outside the measurement range.
The “ARMS INDEX” indicator is not available in currency-market data.
(5.2) Close:
Shows the closing price for the latest trading day:
The color shows the closing-price state compared with the closing price of the previous two periods as follows:
- Olive: the closing price rose above the previous day’s closing price.
- Green: the closing price is still rising compared with the previous two days’ closing prices.
- Light brown: the closing price fell below the previous day’s closing price.
- Red: the closing price is still falling compared with the previous two days’ closing prices.
- Black: the closing price did not change from the previous day’s closing price.
(5.3) Close Direction:
Shows the closing-price direction compared with the closing price of the previous two days:
- Rose: olive / the closing price rose above the previous day’s closing price.
- Rising: green / the closing price is still rising compared with the previous two days’ closing prices.
- Fell: light brown / the closing price fell below the previous day’s closing price.
- Falling: red / the closing price is still falling compared with the previous two days’ closing prices.
- Unchanged: black / the closing price did not change from the previous day’s closing price.
(5.4) Volume:
Shows the traded volume for the latest trading day:
The color shows the volume state compared with the volume of the previous two days:
- Olive: volume increased compared with the previous day’s volume.
- Green: volume is still increasing compared with the previous two days’ volume.
- Light brown: volume decreased compared with the previous day’s volume.
- Red: volume is still decreasing compared with the previous two days’ volume.
- Black: volume did not change from the previous day’s volume.
The Volume field is not available in currency-market versions of the program.
(5.5) Volume State:
Shows the volume state compared with the volume of the previous two days:
- Increased: olive / volume increased compared with the previous day’s volume.
- Increasing: green / volume is still increasing compared with the previous two days’ volume.
- Decreased: light brown / volume decreased compared with the previous day’s volume.
- Decreasing: red / volume is still decreasing compared with the previous two days’ volume.
- Unchanged: black / volume did not change from the previous day’s volume.
The Volume State field is not available in currency-market versions of the program.
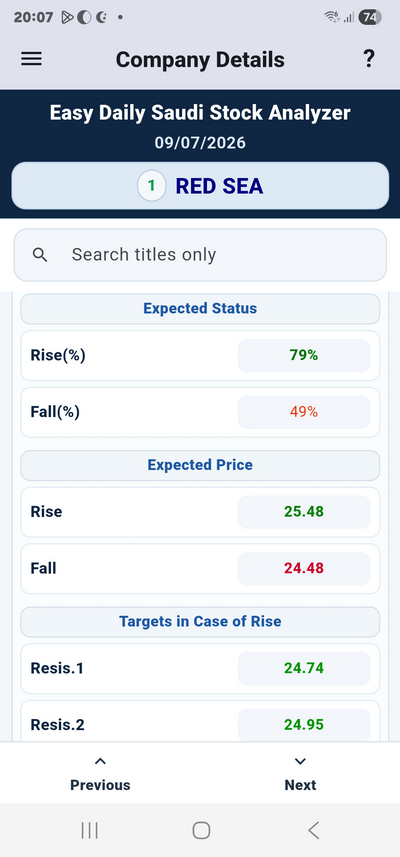
(5.6) Expected State — Rise:
Shows the final expected rise percentage derived from the analysis results of all active technical indicators for the daily, weekly, and monthly periods. This percentage indicates the expected rise of the stock/currency and does not indicate the amount of price rise. It is the same value found in the “Expected Rise” column on the Stock/Currency List page. It also includes the effect of the general index and the effect of other companies/currency pairs. In this analysis, the rise and drop of the technical indicators are analyzed separately, and companies/currency pairs are also compared with one another. Therefore, the rise and drop percentages are variable, and their total is not necessarily 100%.
The font color indicates the following:
- Dark green: rise percentage is greater than 80%.
- Green: rise percentage is greater than 70%.
- Olive: rise percentage is greater than 60%.
- Light green: rise percentage is less than 60%.
- Bold light green: rise percentage is greater than the drop percentage.
If the result is incomplete or unavailable, the value in the Expected Rise field will be (-).
(5.7) Expected State — Drop:
Shows the final expected drop percentage derived from the analysis results of all active technical indicators for the daily, weekly, and monthly periods. This percentage indicates the expected drop of the stock/currency and does not indicate the amount of price drop. It is the same value found in the “Expected Drop” column on the Stock/Currency List page. It also includes the effect of the general index and the effect of other companies/currency pairs. In this analysis, the rise and drop of the technical indicators are analyzed separately, and companies/currency pairs are also compared with one another. Therefore, the rise and drop percentages are variable, and their total is not necessarily 100%.
The font color indicates the following:
- Maroon: drop percentage is greater than 80%.
- Red: drop percentage is greater than 70%.
- Light brown: drop percentage is greater than 60%.
- Orange: drop percentage is less than 60%.
- Bold orange: drop percentage is greater than the rise percentage.
If the result is incomplete or unavailable, the value in the Expected Drop field will be (-).
(5.8) Expected Price in Case of a Rise:
The expected price in case of a rise is the nearest price value to calculated, corrective, and historical resistance prices, Fibonacci retracement levels, and exponential moving averages. Color: the darker the color, the more difficult it is for the expected price to be exceeded.
- Bold light green: the expected rise price is easy to exceed, meaning it is an easy resistance price.
- Light green: the expected rise price is easy to exceed, meaning it is an easier resistance price.
- Green: the expected rise price is difficult to exceed, meaning it is a more difficult resistance price.
- Dark green: the expected rise price is hard to exceed, meaning it is a strong resistance price.
(5.9) Expected Price in Case of a Drop:
The expected price in case of a drop is the nearest price value to calculated, corrective, and historical support prices, Fibonacci retracement levels, and exponential moving averages. Color: the darker the color, the more difficult it is for the expected price to be broken.
- Bold orange: the expected drop price is easy to break, meaning it is an easy support price.
- Orange: the expected drop price is easy to break, meaning it is an easier support price.
- Red: the expected drop price is difficult to break, meaning it is a more difficult support price.
- Maroon: the expected drop price is hard to break, meaning it is a strong support price.
(*) Expected Points for the Coming Period:
Available only in currency-market data:
- Rise / number of expected points in case of a rise. Color: the darker the color, the more difficult it is for the expected rise points to be exceeded.
- Bold light green: the expected rise points are easy to exceed.
- Light green: the expected rise points are easier to exceed.
- Green: the expected rise points are difficult to exceed.
- Dark green: the expected rise points are more difficult to exceed.
- Drop / number of expected points in case of a drop. Color: the darker the color, the more difficult it is for the expected drop points to be exceeded.
- Bold orange: the expected drop points are easy to exceed.
- Orange: the expected drop points are easier to exceed.
- Red: the expected drop points are difficult to exceed.
- Maroon: the expected drop points are more difficult to exceed.
(5.10) Targets in Case of a Rise:
Contains the nine most important and strongest resistance points. These points are combined from calculated, historical, corrective, Fibonacci, and exponential moving-average points in the program, and they also include weekly and monthly resistance points. The font color for these points uses green shades, where the darkness of the color indicates the strength of the point; the darker the color, the stronger the point.
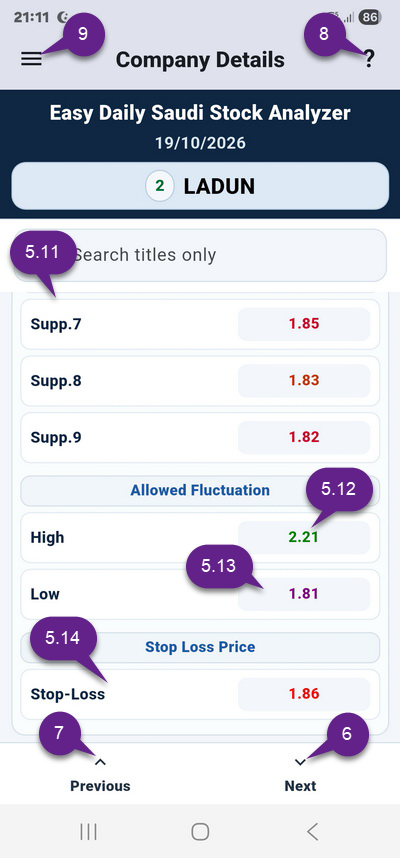
(5.11) Targets in Case of a Drop:
Contains the nine most important and strongest support points. These points are combined from calculated, historical, corrective, Fibonacci, and exponential moving-average points in the program, and they also include weekly and monthly support points. The font color for these points uses red and brown shades, where the darkness of the color indicates the strength of the point; the darker the color, the stronger the point.
(5.12) Allowed Upper Fluctuation:
This is the highest possible price the stock may rise to during the next trading day.
- The “Allowed Upper Fluctuation” field is not available in currency and some markets data.
(5.13) Allowed Lower Fluctuation:
This is the lowest possible price the stock may drop to during the next trading day.
- The “Allowed Lower Fluctuation” field is not available in currency and some markets data.
(5.14) Stop-Loss / Loss-Limit:
It is the strongest and nearest support price to calculated, corrective, or historical resistance prices, Fibonacci retracement levels, or exponential moving-average values, derived according to the technical-analysis results. It always appears in red.
Second,
The results of the analysis of all technical indicators and Buy/Sell Zones for the daily, weekly, and monthly periods after the daily close, including the following:
(5.15) Technical-indicator analysis results for the daily, weekly, and monthly periods after the latest daily close:
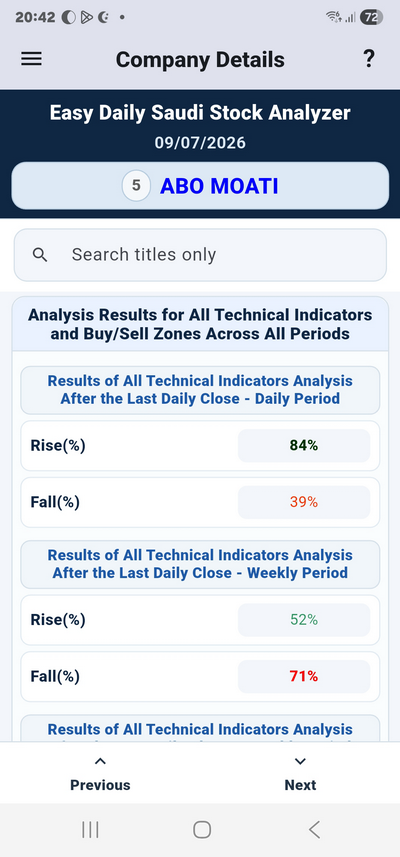
The technical-indicator analysis result is the result of analyzing the active technical indicators for each company/currency pair from among the program indicators. It includes the effect of the general index and the effect of the other companies/currency pairs. In this analysis, the rise and drop of the technical indicators are analyzed separately, and companies/currency pairs are also compared with one another. Therefore, the rise and drop percentages are variable, and their total is not necessarily 100%.
- Rise:
Represents the expected rise percentage:
- Dark green: rise percentage is greater than 80%.
- Green: rise percentage is greater than 70%.
- Olive: rise percentage is greater than 60%.
- Light green: rise percentage is less than 60%.
- Bold light green: rise percentage is greater than the drop percentage.
- Drop:
Represents the expected drop percentage:
- Maroon: drop percentage is greater than 80%.
- Red: drop percentage is greater than 70%.
- Light brown: drop percentage is greater than 60%.
- Orange: drop percentage is less than 60%.
- Bold orange: drop percentage is greater than the rise percentage.
If the result is incomplete, the value in the rise and drop percentage fields will be (-)
(5.16)Tomorrow’s Story Indicator Result for the Daily, Weekly, and Monthly Periods After the Latest Daily Close:
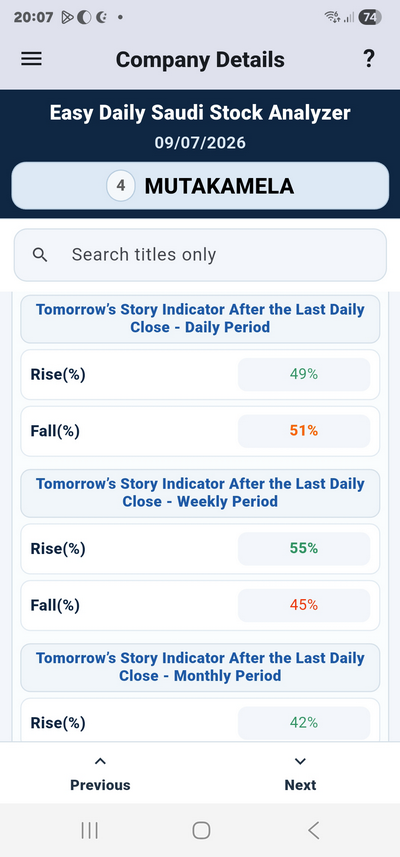
The Tomorrow’s Story indicator is a distinctive new indicator that has demonstrated strong credibility in confirming the signal. It shows the expected rise and drop state based only on the analysis of the most recent period’s trading behavior. It is very useful for confirming the expected rise and drop, and it is not used independently without considering the results of the other indicators and data.
- Rise:
Represents the expected rise percentage:
- Dark green: rise percentage is greater than 80%.
- Green: rise percentage is greater than 70%.
- Olive: rise percentage is greater than 60%.
- Light green: rise percentage is less than 60%.
- Bold light green: rise percentage is greater than the drop percentage.
- Drop:
Represents the expected drop percentage:
- Maroon: drop percentage is greater than 80%.
- Red: drop percentage is greater than 70%.
- Light brown: drop percentage is greater than 60%.
- Orange: drop percentage is less than 60%.
- Bold orange: drop percentage is greater than the rise percentage.
If the result is incomplete, the value in the rise and drop percentage fields will be (-)
(5.17) Candle-Close Indicator Result for the Daily, Weekly, and Monthly Periods After the Latest Daily Close:
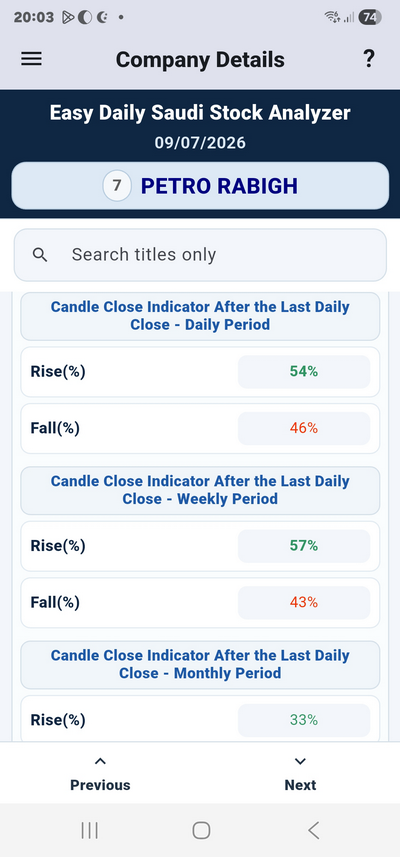
The Candle-Close indicator is a distinctive new indicator that has demonstrated strong credibility in confirming the signal. It shows the expected rise and drop state based on a numerical technical analysis of the close and state of the latest candle and its historical comparison with the closes and states of previous candles. It is also very useful for confirming the expected rise and drop, and it is not used independently without considering the results of the other indicators and data.
Rise:
Represents the expected rise percentage:
- Dark green: rise percentage is greater than 80%.
- Green: rise percentage is greater than 70%.
- Olive: rise percentage is greater than 60%.
- Light green: rise percentage is less than 60%.
- Bold light green: rise percentage is greater than the drop percentage.
Drop:
Represents the expected drop percentage:
- Maroon: drop percentage is greater than 80%.
- Red: drop percentage is greater than 70%.
- Light brown: drop percentage is greater than 60%.
- Orange: drop percentage is less than 60%.
- Bold orange: drop percentage is greater than the rise percentage.
If the result is incomplete, the value in the rise and drop percentage fields will be (-)
(5.18) General state of the Buy/Sell Zones for the daily, weekly, and monthly periods after the latest daily close:
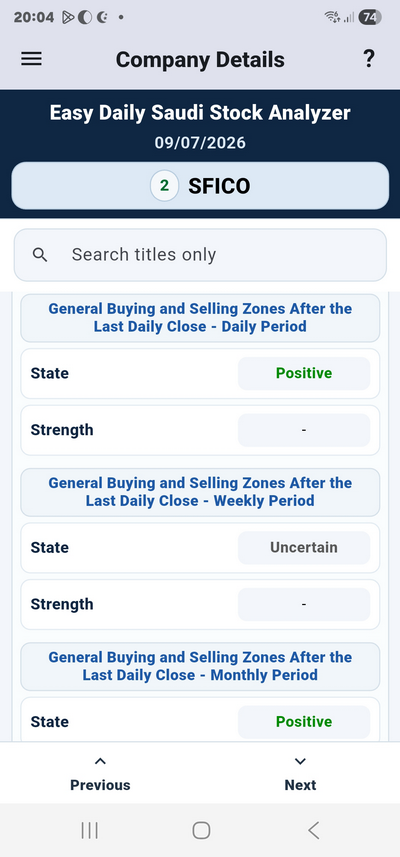
Shows the state, whether positive, negative, or confusing, of the Buy/Sell Zones when they are analyzed together in general, and it shows the strength of the positivity or negativity if it exists.
General-state colors are as follows:
- Green: the state is positive.
- Red: the state is negative.
- Gray: the state is confusing.
Colors of positive and negative strength are as follows:
- Light green: Positive — indicates a Buy Zone.
- Green: Strong Positive — indicates a breakout above a previous Sell Zone.
- Dark green: Strong Positive+ — indicates a Buy Zone combined with a breakout above a previous Sell Zone.
- Red: Negative — indicates a Sell Zone.
- Brown: Strong Negative — indicates a breakdown below a previous Buy Zone.
- Dark brown: Strong Negative+ — indicates a Sell Zone combined with a breakdown below a previous Buy Zone.
State of the latest Buy or Sell Zone for the daily, weekly, and monthly periods after the latest daily close:
Shows the current zone state after the latest daily close.
State colors are as follows:
- Light green: the state is positive.
- Green: the state is strongly positive.
- Dark green: the state is strongly positive+.
- Red: the state is negative.
- Brown: the state is strongly negative.
- Dark brown: the state is strongly negative+.
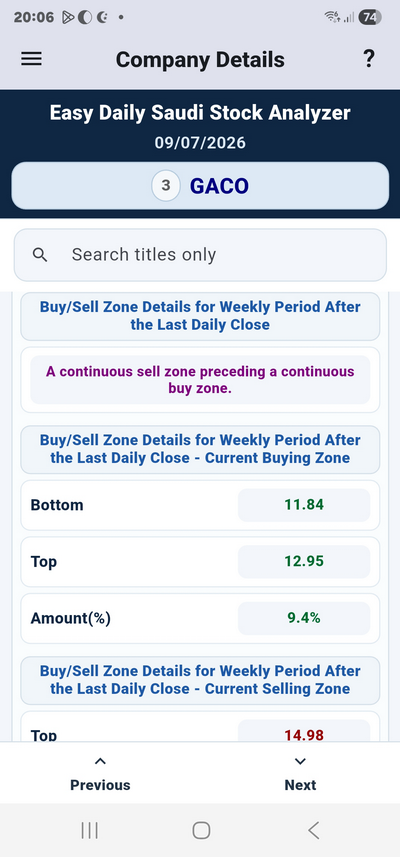
(5.19) Details of the Buy/Sell Zone Details Section After the Latest Daily Close:
Shows the important details of the Buy/Sell Zones after the latest daily close for the daily, weekly, and monthly periods. For each period, the details include a general description of the Buy and Sell Zones, as well as the low, high, and range of the current Buy and Sell Zones.
The general description of the Buy and Sell Zones does not go beyond the following:
- The latest Sell Zone has been broken and there are no Buy Zones.
- The latest Sell Zone has been broken, a previous Sell Zone exists, and there are no Buy Zones.
- A new continuation Sell Zone and there are no Buy Zones.
- A new Sell Zone and there are no Buy Zones.
- A previous Sell Zone and there are no Buy Zones.
- A continuing Sell Zone and there are no Buy Zones.
- The latest Buy Zone has been broken and there are no Sell Zones.
- A new continuation Sell Zone with a break of the latest Buy Zone.
- A new Sell Zone with a break of the latest Buy Zone.
- The latest Buy Zone has been broken and a previous Sell Zone exists.
- The latest Buy Zone has been broken and a continuing Sell Zone exists.
- The latest Buy Zone has been broken, a previous Buy Zone exists, and there are no Sell Zones.
- A new continuation Sell Zone with a break of the latest Buy Zone and a previous Buy Zone exists.
- A new Sell Zone with a break of the latest Buy Zone and a previous Buy Zone exists.
- The latest Buy Zone has been broken, a previous Buy Zone exists, and a continuing Sell Zone exists.
- A new continuation Buy Zone and there are no Sell Zones.
- A new continuation Buy Zone with a break of the latest Sell Zone.
- A new continuation Buy Zone with a break of the latest Sell Zone and a previous Sell Zone exists.
- A new continuation Buy Zone and a previous Sell Zone exists.
- A new continuation Buy Zone and a continuing Sell Zone exists.
- A new Buy Zone and there are no Sell Zones.
- A new Buy Zone with a break of the latest Sell Zone.
- A new Buy Zone with a break of the latest Sell Zone and a previous Sell Zone exists.
- A new Buy Zone and a previous Sell Zone exists.
- A new Buy Zone and a continuing Sell Zone exists.
- A previous Buy Zone and there are no Sell Zones.
- The latest Sell Zone has been broken and a previous Buy Zone exists.
- A new continuation Sell Zone and a previous Buy Zone exists.
- A new Sell Zone and a previous Buy Zone exists.
- A continuing Sell Zone and a previous Buy Zone exists.
- A continuing Buy Zone and there are no Sell Zones.
- The latest Sell Zone has been broken and a continuing Buy Zone exists.
- The latest Sell Zone has been broken, a previous Sell Zone exists, and a continuing Buy Zone exists.
- A new continuation Sell Zone and a continuing Buy Zone exists.
- A new Sell Zone and a continuing Buy Zone exists.
- A continuing Buy Zone and a previous Sell Zone exists.
- The latest Buy Zone has been broken and a previous Buy Zone that precedes a previous Sell Zone exists.
- The latest Buy Zone has been broken and a previous Sell Zone that precedes a previous Buy Zone exists.
- The latest Sell Zone has been broken and a previous Buy Zone that precedes a previous Sell Zone exists.
- The latest Sell Zone has been broken and a previous Sell Zone that precedes a previous Buy Zone exists.
- A previous Buy Zone precedes a previous Sell Zone.
- A previous Sell Zone precedes a previous Buy Zone.
- A continuing Buy Zone precedes a continuing Sell Zone.
- A continuing Sell Zone precedes a continuing Buy Zone.
- There are no clear Buy or Sell Zones after a break of the latest Buy Zone.
- There are no clear Buy or Sell Zones after a break of the latest Sell Zone.
- There are no clear Buy or Sell Zones.
For each period, the details also include the total number of Buy Zones and Sell Zones after the latest daily close.
Details of the Technical-Indicator Analysis Results and Buy/Sell Zones Section After Each Period’s Close:
Shows the results after the latest weekly close for the weekly period, and after the latest monthly close for the monthly period. The daily period is shown again in this section for easier comparison with the other periods, and it contains the following:
Technical-indicator analysis results for the daily, weekly, and monthly periods after each period’s close:
The technical-indicator analysis result is the result of analyzing the active technical indicators for each company/currency pair from among the program indicators. It includes the effect of the general index and the effect of the other companies/currency pairs. In this analysis, the rise and drop of the technical indicators are analyzed separately, and companies/currency pairs are also compared with one another. Therefore, the rise and drop percentages are variable, and their total is not necessarily 100%.
- Rise:
Represents the expected rise percentage:
- Dark green: rise percentage is greater than 80%.
- Green: rise percentage is greater than 70%.
- Olive: rise percentage is greater than 60%.
- Light green: rise percentage is less than 60%.
- Bold light green: rise percentage is greater than the drop percentage.
- Drop:
Represents the expected drop percentage:
- Maroon: drop percentage is greater than 80%.
- Red: drop percentage is greater than 70%.
- Light brown: drop percentage is greater than 60%.
- Orange: drop percentage is less than 60%.
- Bold orange: drop percentage is greater than the rise percentage.
If the result is incomplete, the value in the rise and drop percentage fields will be (-)
Tomorrow’s Story indicator results for the daily, weekly, and monthly periods after each period’s close:
The Tomorrow’s Story indicator is a distinctive new indicator that has demonstrated strong credibility in confirming the signal. It shows the expected rise and drop state based only on the analysis of the most recent period’s trading behavior. It is very useful for confirming the expected rise and drop, and it is not used independently without considering the results of the other indicators and data.
- Rise:
Represents the expected rise percentage:
- Dark green: rise percentage is greater than 80%.
- Green: rise percentage is greater than 70%.
- Olive: rise percentage is greater than 60%.
- Light green: rise percentage is less than 60%.
- Bold light green: rise percentage is greater than the drop percentage.
- Drop:
Represents the expected drop percentage:
- Maroon: drop percentage is greater than 80%.
- Red: drop percentage is greater than 70%.
- Light brown: drop percentage is greater than 60%.
- Orange: drop percentage is less than 60%.
- Bold orange: drop percentage is greater than the rise percentage.
If the result is incomplete, the value in the rise and drop percentage fields will be (-)
Candle-Close indicator results for the daily, weekly, and monthly periods after each period’s close:
The Candle-Close indicator is a distinctive new indicator that has demonstrated strong credibility in confirming the signal. It shows the expected rise and drop state based on a numerical technical analysis of the close and state of the latest candle and its historical comparison with the closes and states of previous candles. It is also very useful for confirming the expected rise and drop, and it is not used independently without considering the results of the other indicators and data.
- Rise:
Represents the expected rise percentage:
- Dark green: rise percentage is greater than 80%.
- Green: rise percentage is greater than 70%.
- Olive: rise percentage is greater than 60%.
- Light green: rise percentage is less than 60%.
- Bold light green: rise percentage is greater than the drop percentage.
- Drop:
Represents the expected drop percentage:
- Maroon: drop percentage is greater than 80%.
- Red: drop percentage is greater than 70%.
- Light brown: drop percentage is greater than 60%.
- Orange: drop percentage is less than 60%.
- Bold orange: drop percentage is greater than the rise percentage.
If the result is incomplete, the value in the rise and drop percentage fields will be (-).
General state of the Buy/Sell Zones for the daily, weekly, and monthly periods after each period’s close:
Shows the state, whether positive, negative, or confusing, of the Buy/Sell Zones when they are analyzed together in general, and it shows the strength of the positivity or negativity if it exists.
General-state colors are as follows:
- Green: the state is positive.
- Red: the state is negative.
- Gray: the state is confusing.
Colors of positive and negative strength are as follows:
- Light green: Positive — indicates a Buy Zone.
- Green: Strong Positive — indicates a breakout above a previous Sell Zone.
- Dark green: Strong Positive+ — indicates a Buy Zone combined with a breakout above a previous Sell Zone.
- Red: Negative — indicates a Sell Zone.
- Brown: Strong Negative — indicates a breakdown below a previous Buy Zone.
- Dark brown: Strong Negative+ — indicates a Sell Zone combined with a breakdown below a previous Buy Zone.
State of the latest Buy or Sell Zone for the daily, weekly, and monthly periods after each period’s close:
shows the current zone state after the latest close for each period.
State colors are as follows:
- Light green: the state is positive.
- Green: the state is strongly positive.
- Dark green: the state is strongly positive+.
- Red: the state is negative.
- Brown: the state is strongly negative.
- Dark brown: the state is strongly negative+.
Details of the Buy/Sell Zone Details Section After Each Period’s Close:
Shows the important details of the Buy/Sell Zones after the latest weekly close for the weekly period, and after the latest monthly close for the monthly period. For the weekly and monthly periods, the details include the closing price and state, a general description of the Buy and Sell Zones, and the low, high, and range of the current Buy and Sell Zones:
Weekly/Monthly Close:
- Olive / the closing price rose above the previous period’s closing price.
- Green / the closing price is still rising compared with the previous two periods’ closing prices.
- Light brown / the closing price fell below the previous period’s closing price.
- Red / the closing price is still falling compared with the previous two periods’ closing prices.
- Black / the closing price did not change from the previous period’s closing price.
Direction:
Shows the state of companies/currency pairs and the general index according to the closing-price direction compared with the previous two periods.
- Rose: olive / the closing price rose above the previous period’s closing price.
- Rising: green / the closing price is still rising compared with the previous two periods’ closing prices.
- Fell: light brown / the closing price fell below the previous period’s closing price.
- Falling: red / the closing price is still falling compared with the previous two periods’ closing prices.
- Unchanged: black / the closing price did not change from the previous period’s closing price.
The general description of the Buy and Sell Zones does not go beyond the following:
- The latest Sell Zone has been broken and there are no Buy Zones.
- The latest Sell Zone has been broken, a previous Sell Zone exists, and there are no Buy Zones.
- A new continuation Sell Zone and there are no Buy Zones.
- A new Sell Zone and there are no Buy Zones.
- A previous Sell Zone and there are no Buy Zones.
- A continuing Sell Zone and there are no Buy Zones.
- The latest Buy Zone has been broken and there are no Sell Zones.
- A new continuation Sell Zone with a break of the latest Buy Zone.
- A new Sell Zone with a break of the latest Buy Zone.
- The latest Buy Zone has been broken and a previous Sell Zone exists.
- The latest Buy Zone has been broken and a continuing Sell Zone exists.
- The latest Buy Zone has been broken, a previous Buy Zone exists, and there are no Sell Zones.
- A new continuation Sell Zone with a break of the latest Buy Zone and a previous Buy Zone exists.
- A new Sell Zone with a break of the latest Buy Zone and a previous Buy Zone exists.
- The latest Buy Zone has been broken, a previous Buy Zone exists, and a continuing Sell Zone exists.
- A new continuation Buy Zone and there are no Sell Zones.
- A new continuation Buy Zone with a break of the latest Sell Zone.
- A new continuation Buy Zone with a break of the latest Sell Zone and a previous Sell Zone exists.
- A new continuation Buy Zone and a previous Sell Zone exists.
- A new continuation Buy Zone and a continuing Sell Zone exists.
- A new Buy Zone and there are no Sell Zones.
- A new Buy Zone with a break of the latest Sell Zone.
- A new Buy Zone with a break of the latest Sell Zone and a previous Sell Zone exists.
- A new Buy Zone and a previous Sell Zone exists.
- A new Buy Zone and a continuing Sell Zone exists.
- A previous Buy Zone and there are no Sell Zones.
- The latest Sell Zone has been broken and a previous Buy Zone exists.
- A new continuation Sell Zone and a previous Buy Zone exists.
- A new Sell Zone and a previous Buy Zone exists.
- A continuing Sell Zone and a previous Buy Zone exists.
- A continuing Buy Zone and there are no Sell Zones.
- The latest Sell Zone has been broken and a continuing Buy Zone exists.
- The latest Sell Zone has been broken, a previous Sell Zone exists, and a continuing Buy Zone exists.
- A new continuation Sell Zone and a continuing Buy Zone exists.
- A new Sell Zone and a continuing Buy Zone exists.
- A continuing Buy Zone and a previous Sell Zone exists.
- The latest Buy Zone has been broken and a previous Buy Zone that precedes a previous Sell Zone exists.
- The latest Buy Zone has been broken and a previous Sell Zone that precedes a previous Buy Zone exists.
- The latest Sell Zone has been broken and a previous Buy Zone that precedes a previous Sell Zone exists.
- The latest Sell Zone has been broken and a previous Sell Zone that precedes a previous Buy Zone exists.
- A previous Buy Zone precedes a previous Sell Zone.
- A previous Sell Zone precedes a previous Buy Zone.
- A continuing Buy Zone precedes a continuing Sell Zone.
- A continuing Sell Zone precedes a continuing Buy Zone.
- There are no clear Buy or Sell Zones after a break of the latest Buy Zone.
- There are no clear Buy or Sell Zones after a break of the latest Sell Zone.
- There are no clear Buy or Sell Zones.
In the section for the current Buy/Sell Zone in both periods, the font color becomes red at the low of the Buy Zone if it was broken after the latest daily close, and it becomes green at the high of the Sell Zone if it was broken after the latest daily close.
For each period, the details also include the total number of Buy Zones and Sell Zones after each period’s latest close.
Third,
(5.20) Technical Indicator Data:
This includes the value, direction, state, sell percentage, and buy percentage for each technical indicator, from more than forty different technical indicators, for all companies/currency pairs. The states and buy/sell percentages of these indicators are derived numerically by the program during the daily update and analysis process.
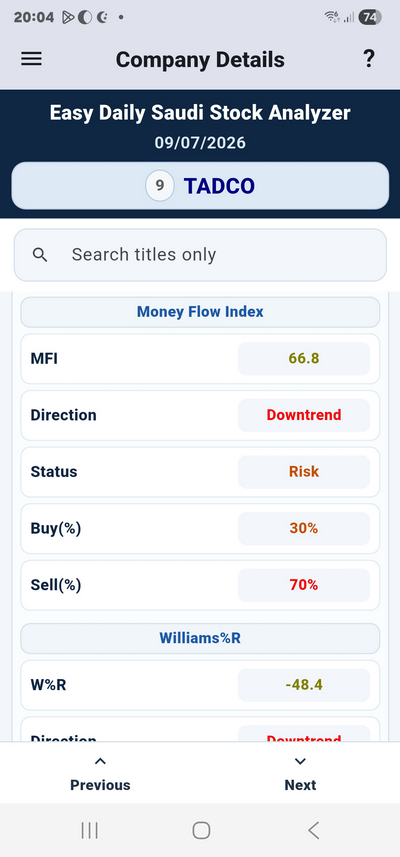
Colors play an important role in displaying this data in a way that is easy to understand at first glance, as follows:
- Red and brown: always express risky states and sell signals for the values, directions, states, and buy/sell percentages of each technical indicator.
- Green and olive: always express safe states and buy signals for the values, directions, states, and buy/sell percentages of each technical indicator.
- Blue and black: always express confusing or ignored states for the values, directions, states, and buy/sell percentages of each technical indicator.
- Red and brown: always express risky states and sell signals for the values, directions, states, and buy/sell percentages of each technical indicator.
- Green and gold: always express safe states and buy signals for the values, directions, states, and buy/sell percentages of each technical indicator.
- Technical Indicator Name:
Shows the name of the technical indicator whose data is displayed below it.
- Technical Indicator Value:
Shows the technical indicator value.
- Red: the indicator value is risky.
- Green: the indicator value is safe.
- Olive: the indicator value is confusing.
- Dark blue: the indicator value is ineffective or ignored.
- Technical Indicator Direction:
Shows the technical indicator direction compared with the previous two days. The comparison can only be one of the following states: fell, rose, falling, rising, or unchanged. The colors express the direction state:
- Light brown: the indicator direction is risky.
- Olive: the indicator direction is safe.
- Red: the indicator direction is risky-sell.
- Green: the indicator direction is safe-buy.
- Black: the indicator direction is flat — unchanged.
- Technical Indicator State:
Shows the technical indicator state based on its value and direction. The indicator state can only be one of the following: risky, sell, safe, buy, or confusing. The colors express the state:
- Light brown: the indicator state is risky.
- Olive: the indicator state is safe.
- Red: the indicator state is risky-sell or the indicator state is confusing.
- Green: the indicator state is safe-buy.
- Black: the indicator state is confusing.
- Buy and Sell Percentage:
Shows the buy and sell percentage for the technical indicator based on its value, direction, and state. The colors for the buy and sell percentage value are as follows:
- Light brown: the percentage is risky.
- Olive: the percentage is safe.
- Red: the percentage is risky-sell.
- Green: the percentage is safe-buy.
* The following technical indicators are not available in currency-market data:
- Money Flow Index.
- Accumulation/Distribution.
- Volume Oscillator.
- On Balance Volume.
- Ease of Movement.
- Volume Rate of Change.
- Chaikin Oscillator.
- Chaikin Money Flow
(6) Next Button:
Used to display the main information of the next stock/currency according to the serial number of the stocks/currencies shown on the Stock/Currency List page.
(7) Previous Button:
Used to display the main information of the previous stock/currency according to the serial number of the stocks/currencies shown on the Stock/Currency List page.
(8) Help Icon:
Opens the help for the current page.
(9) Main App Menu Button:
Opens the main app menu.