

All Stocks/Currency Pairs List
This screen contains a list of all stocks/currency pairs, together with the general index for the selected market, that were traded on the latest trading day. It displays the final automated technical-analysis result for each stock/currency pair as expected-rise and expected-drop percentages, together with expected prices, close price, and close state. From this screen, the user can apply filters, strategies, favorites, ranking, and numerical comparison to all stocks/currency pairs, and can open the main information card for any stock/currency pair.
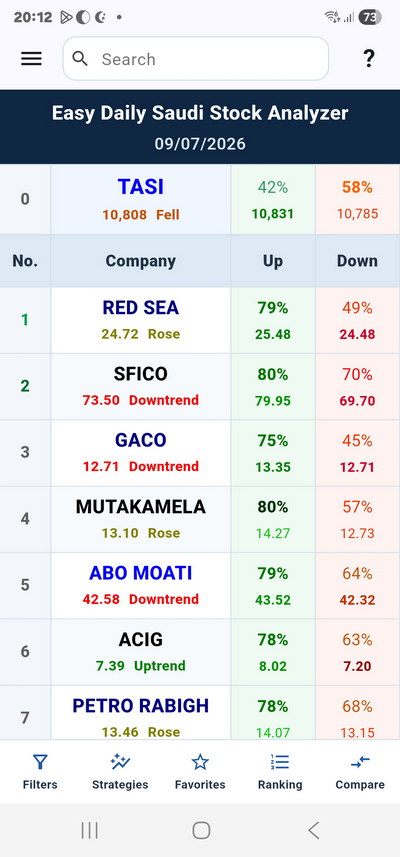
When the screen is opened for the first time, the list is ranked bullishly for all stocks/currency pairs, meaning it is ordered by their readiness to rise for the next day. The smaller the serial number in the first column, the more technically qualified the stock/currency pair is for rise. In stock-market versions, the general index always appears first before any stock. Pressing a stock/currency-pair name or the general index opens its main card.
The Screen Contains the Following
(1) Market Name
Displays the market selected from the app Home Screen.
(2) Update Date
Shows the program data update date, which is the latest trading day. The results shown for that date are intended for use on the next trading day. Stock-market data is updated after the close by at least five hours, during which historical computer studies, checks, and numerical readings are performed for all periods after adding the new trading data. In the Forex version, the update is performed at 00:00 GMT at the end of each trading day. The update time may increase or decrease slightly depending on the number of companies in each market, the availability of daily data, and any required correction.
(3) First Column — Serial Number
Displays a serial number for each stock/currency pair traded during the latest day. This number changes after each update based on technical-analysis results and indicates the instrument’s strength and readiness for rise compared with other instruments. Rank (1) is more qualified for rise than rank (2), rank (2) is more qualified than rank (3), and so on.
- Light green: the stock/currency pair belongs to the “Bullish Favorites” list.
- Dark green: the stock/currency pair belongs to the “Top Bullish” list.
- Light red: the stock/currency pair belongs to the “Bearish Favorites” list.
- Dark red: the stock/currency pair belongs to the “Top Bearish” list.
- Gray: the stock/currency pair does not belong to any list.
(4) Second Column — Stock/Currency-Pair Names
Shows the names of stocks/currency pairs traded during the latest day. The name color ranges from blue to black and indicates the expected upward price amount: the darker the color, the greater the expected rise price after automated technical analysis. Pressing the name opens the main information page for that stock/currency pair or general index. Under the name, the close price and its direction are shown; the color indicates the close state compared with the previous two closes:
- Olive: the close price rose compared with the previous close.
- Green: the close price is still rising compared with the previous two closes.
- Light brown: the close price fell compared with the previous close.
- Red: the close price is still falling compared with the previous two closes.
- Black: the close price did not change compared with the previous close.
(5) Third Column — Expected Rise
Shows the final expected-rise percentage inferred from the analysis results of all effective technical indicators for the daily, weekly, and monthly periods. This percentage indicates the expectation of rise, not the exact price-move amount. It includes the effect of the general index and the effect of the rest of the companies/currency pairs. Rise and drop are analyzed separately and instruments are also compared with one another; therefore, expected-rise and expected-drop percentages vary and their total does not necessarily equal 100%. Under the rise percentage, the expected price in case of rise is displayed. It is the closest upward price level among calculated, corrective, historical, Fibonacci, and EMA levels based on the average result of the technical-indicator analysis.
- Dark green: the rise percentage is greater than 80%.
- Green: the rise percentage is greater than 70%.
- Olive: the rise percentage is greater than 60%.
- Light green: the rise percentage is less than 60%.
- Wide light green: the rise percentage is greater than the drop percentage.
The darker the color of the expected rise price, the more difficult the price is to exceed:
- Wide light green: the expected rise price is easy to exceed; it is an easy resistance.
- Light green: the expected rise price is easy to exceed; it is an easier resistance.
- Green: the expected rise price is difficult to exceed; it is a more difficult resistance.
- Dark green: the expected rise price is difficult to exceed; it is a strong resistance.
(6) Fourth Column — Expected Drop
Shows the final expected-drop percentage inferred from the analysis results of all effective technical indicators for the daily, weekly, and monthly periods. This percentage indicates the expectation of drop, not the exact price-move amount. It includes the effect of the general index and the effect of other companies/currency pairs. Under the drop percentage, the expected price in case of drop is displayed. It is the closest downward price level among calculated, corrective, historical, Fibonacci, and EMA support levels based on the average technical-analysis result.
- Maroon: the drop percentage is greater than 80%.
- Red: the drop percentage is greater than 70%.
- Light brown: the drop percentage is greater than 60%.
- Orange: the drop percentage is less than 60%.
- Wide orange: the drop percentage is greater than the rise percentage.
The darker the color of the expected drop price, the more difficult the support is to break:
- Wide orange: the expected drop price is easy to break; it is an easy support.
- Orange: the expected drop price is easy to break; it is an easier support.
- Red: the expected drop price is difficult to break; it is a more difficult support.
- Maroon: the expected drop price is difficult to break; it is a strong support.
(7) Filters Button
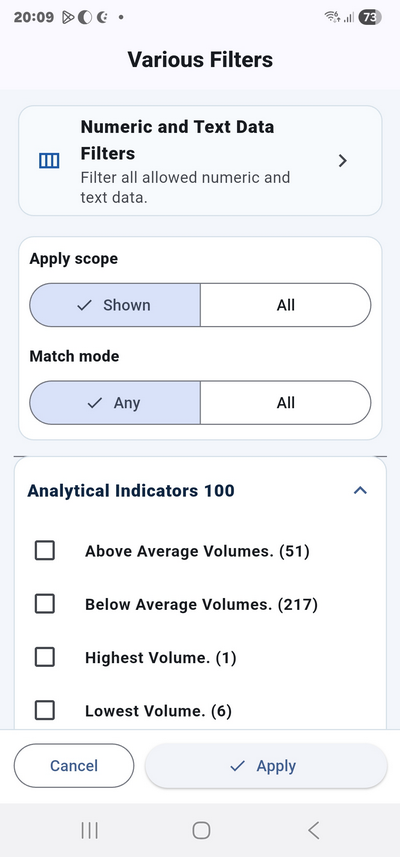
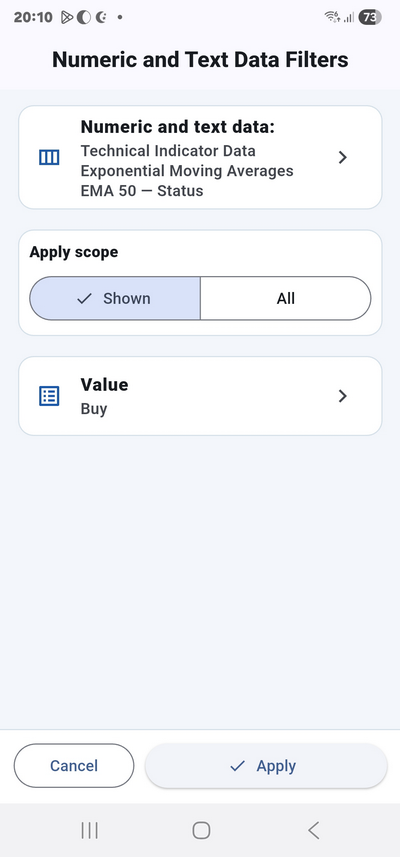
Displays the Miscellaneous Filters window, through which filtering can be performed and most of the app’s data and results can be used. The first part is “Numerical and Text Data Filters”, which opens an internal filtering window containing selectable numerical and text data that are available and permitted for filtering from the app’s Details screen. These options are distributed across three lists: Main Data, Technical Indicator Analysis Results and Buy/Sell Zones for all periods, and Technical Indicator Data. Filtering can be applied either to the currently displayed instruments, meaning the visible stocks/currency pairs, or to all instruments after making the selection. The second part consists of pre-prepared filter lists that have been carefully selected to make it easier to benefit from all app data and to simplify filtering and searching operations. These filters are very useful and save time and effort. Next to each option, the number of matching companies/currency pairs is shown. The number of filters may increase or decrease depending on the program/market. They are as follows:
Chart Indicators 100 List
A diverse and unique set of filters for the latest 100 trading days only:
- Above average volumes. (xxx)
- Below average volumes. (xxx)
- Highest volume. (xxx)
- Lowest volume. (xxx)
- Beginning of a positive trend change. (xxx)
- Beginning of a negative trend change. (xxx)
- Uptrend. (xxx)
- Downtrend. (xxx)
- Close at a new high. (xxx)
- Close at a new low. (xxx)
- Reached a high and closed below it. (xxx)
- Reached a low and closed above it. (xxx)
(xxx) indicates the number of matching stocks/currency pairs.
Positive Miscellaneous Filters List
- Positive in all analysis results for all periods after the daily close. (xxx)
- Positive in all analysis results for the daily period after the daily close. (xxx)
- Positive in all analysis results for the weekly period after the daily close. (xxx)
- Positive in all analysis results for the monthly period after the daily close. (xxx)
- Positive in all technical-indicators analysis results for all periods after the daily close. (xxx)
- Positive in Tomorrow’s Story and Candle-Close indicators for all periods after the daily close. (xxx)
- Positive in Buy/Sell Zones for all periods after the daily close. (xxx)
- Has strong or strong+ positivity in Buy/Sell Zone strength in one of the periods after the daily close. (xxx)
- Positive in all analysis results for the weekly period after the weekly close. (xxx)
- Positive in technical indicators, Tomorrow’s Story, and Candle-Close for the weekly period after the weekly close. (xxx)
- Positive in Buy/Sell Zones for the weekly period after the weekly close. (xxx)
- Has strong or strong+ positivity in Buy/Sell Zone strength for the weekly period after the weekly close. (xxx)
- Positive in all analysis results for the monthly period after the monthly close. (xxx)
- Positive in technical indicators, Tomorrow’s Story, and Candle-Close for the monthly period after the monthly close. (xxx)
- Positive in Buy/Sell Zones for the monthly period after the monthly close. (xxx)
- Has strong or strong+ positivity in Buy/Sell Zone strength for the monthly period after the monthly close. (xxx)
(xxx) indicates the number of matching stocks/currency pairs.
Negative Miscellaneous Filters List
- Negative in all analysis results for all periods after the daily close. (xxx)
- Negative in all analysis results for the daily period after the daily close. (xxx)
- Negative in all analysis results for the weekly period after the daily close. (xxx)
- Negative in all analysis results for the monthly period after the daily close. (xxx)
- Negative in all technical-indicators analysis results for all periods after the daily close. (xxx)
- Negative in Tomorrow’s Story and Candle-Close indicators for all periods after the daily close. (xxx)
- Negative in Buy/Sell Zones for all periods after the daily close. (xxx)
- Has strong or strong+ negativity in Buy/Sell Zone strength in one of the periods after the daily close. (xxx)
- Negative in all analysis results for the weekly period after the weekly close. (xxx)
- Negative in technical indicators, Tomorrow’s Story, and Candle-Close for the weekly period after the weekly close. (xxx)
- Negative in Buy/Sell Zones for the weekly period after the weekly close. (xxx)
- Has strong or strong+ negativity in Buy/Sell Zone strength for the weekly period after the weekly close. (xxx)
- Negative in all analysis results for the monthly period after the monthly close. (xxx)
- Negative in technical indicators, Tomorrow’s Story, and Candle-Close for the monthly period after the monthly close. (xxx)
- Negative in Buy/Sell Zones for the monthly period after the monthly close. (xxx)
- Has strong or strong+ negativity in Buy/Sell Zone strength for the monthly period after the monthly close. (xxx)
(xxx) indicates the number of matching stocks/currency pairs.
Other Miscellaneous Filters List
- Volumes increased above the 3-day average. (xxx)
- Broke one of the Buy or Sell Zones in one of the periods after the latest daily, weekly, or monthly close after the latest daily close. (xxx)
- Broke the previous Sell Zone on the daily period after the latest daily close. (xxx)
- Broke the previous Buy Zone on the daily period after the latest daily close. (xxx)
- Inside the current Buy Zone on the daily period after the latest daily close. (xxx)
- Above the current Buy Zone on the daily period after the latest daily close. (xxx)
- Inside the current Sell Zone on the daily period after the latest daily close. (xxx)
- Below the current Sell Zone on the daily period after the latest daily close. (xxx)
- Broke the current Sell Zone on the weekly period after the latest daily close. (xxx)
- Broke the current Buy Zone on the weekly period after the latest daily close. (xxx)
- Inside the current Buy Zone on the weekly period after the latest daily close. (xxx)
- Above the current Buy Zone on the weekly period after the latest daily close. (xxx)
- Inside the current Sell Zone on the weekly period after the latest daily close. (xxx)
- Below the current Sell Zone on the weekly period after the latest daily close. (xxx)
- Broke the current Sell Zone on the monthly period after the latest daily close. (xxx)
- Broke the current Buy Zone on the monthly period after the latest daily close. (xxx)
- Inside the current Buy Zone on the monthly period after the latest daily close. (xxx)
- Above the current Buy Zone on the monthly period after the latest daily close. (xxx)
- Inside the current Sell Zone on the monthly period after the latest daily close. (xxx)
- Below the current Sell Zone on the monthly period after the latest daily close. (xxx)
- Broke the previous Sell Zone on the weekly period after the latest weekly close. (xxx)
- Broke the previous Buy Zone on the weekly period after the latest weekly close. (xxx)
- Inside the current Buy Zone on the weekly period after the latest weekly close. (xxx)
- Above the current Buy Zone on the weekly period after the latest weekly close. (xxx)
- Inside the current Sell Zone on the weekly period after the latest weekly close. (xxx)
- Below the current Sell Zone on the weekly period after the latest weekly close. (xxx)
- Broke the previous Sell Zone on the monthly period after the latest monthly close. (xxx)
- Broke the previous Buy Zone on the monthly period after the latest monthly close. (xxx)
- Inside the current Buy Zone on the monthly period after the latest monthly close. (xxx)
- Above the current Buy Zone on the monthly period after the latest monthly close. (xxx)
- Inside the current Sell Zone on the monthly period after the latest monthly close. (xxx)
- Below the current Sell Zone on the monthly period after the latest monthly close. (xxx)
(xxx) indicates the number of matching stocks/currency pairs. Filters may be increased automatically whenever their usefulness is proven.
(8) Strategies Button
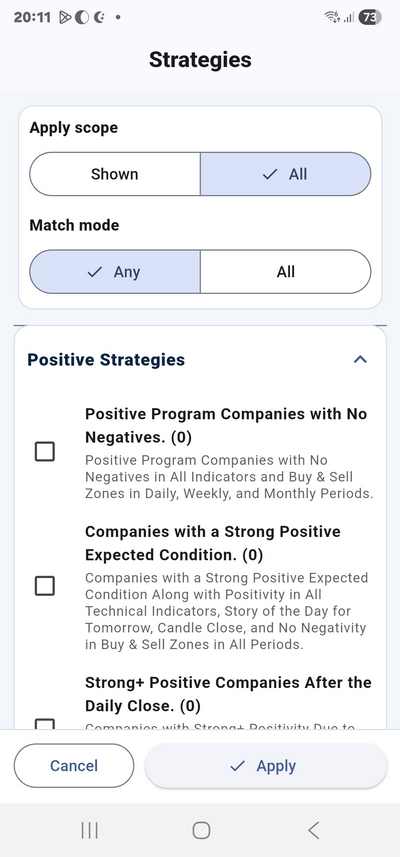
Displays the Strategies window. It filters instruments that meet the selected strategy among the displayed instruments or all instruments. The window contains positive and negative strategy lists carefully designed to be effective and reliable. Under the name of each strategy, a short description appears. Next to each strategy, the number of matching stocks/currency pairs is shown.
Positive Strategies
- Positive program companies with no negativity. (xxx)
- Companies with a strong positive expected state. (xxx)
- Strong+ positive companies after the daily close. (xxx)
- Companies positive on both the daily and weekly periods. (xxx)
- Companies positive on both the daily and monthly periods. (xxx)
- Companies positive in all periods. (xxx)
- Strong+ positive companies on the weekly period. (xxx)
- Strong+ positive companies on the monthly period. (xxx)
- Positive EMA strategy. (xxx)
- Positive in selected technical indicators 1. (xxx)
- Positive in selected technical indicators 2. (xxx)
- Positive in selected technical indicators 3. (xxx)
Negative Strategies
- Negative program companies with no positivity. (xxx)
- Companies with a strong negative expected state. (xxx)
- Strong+ negative companies after the daily close. (xxx)
- Companies negative on both the daily and weekly periods. (xxx)
- Companies negative on both the daily and monthly periods. (xxx)
- Companies negative in all periods. (xxx)
- Strong+ negative companies on the weekly period. (xxx)
- Strong+ negative companies on the monthly period. (xxx)
- Negative EMA strategy. (xxx)
Strategies may be increased automatically after their success and effectiveness are verified.
(9) Favorites Button
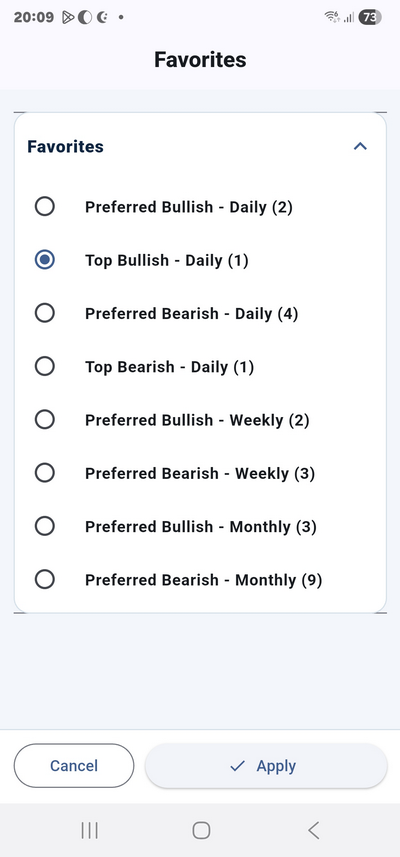
Displays the Favorites window. It shows lists of positive stocks/currency pairs that are more qualified for rise and negative stocks/currency pairs that are more qualified for drop. Each list contains instruments that have met specific technical conditions, and next to every choice the number of matching instruments is shown.
- Bullish Favorites — Daily: positive instruments with strong agreement in selected daily technical-analysis results.
- Top Bullish — Daily: safer instruments, more qualified for rise, with strong agreement in all daily technical-analysis results.
- Bearish Favorites — Daily: negative instruments with strong agreement in selected daily technical-analysis results.
- Top Bearish — Daily: riskier instruments, more qualified for drop, with strong agreement in all daily technical-analysis results.
- Bullish Favorites — Weekly: positive instruments with positive weekly-period agreement after the weekly close.
- Bearish Favorites — Weekly: negative instruments with negative weekly-period agreement after the weekly close.
- Bullish Favorites — Monthly: positive instruments with positive monthly-period agreement after the monthly close.
- Bearish Favorites — Monthly: negative instruments with negative monthly-period agreement after the monthly close.
Favorites may be increased automatically after their effectiveness and success are proven.
(10) Ranking Button
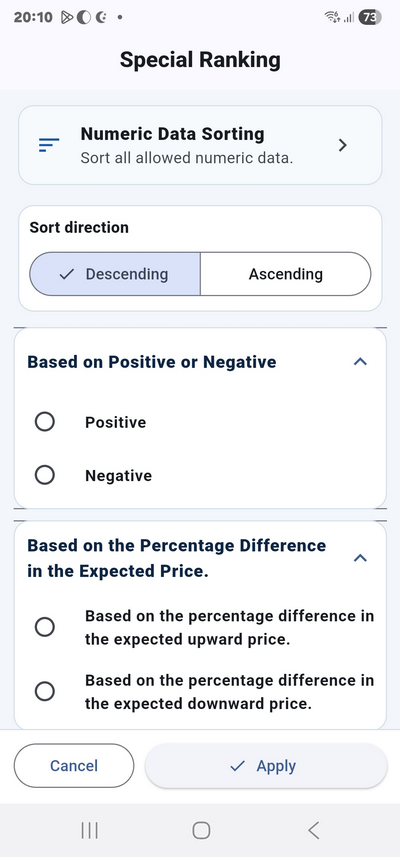
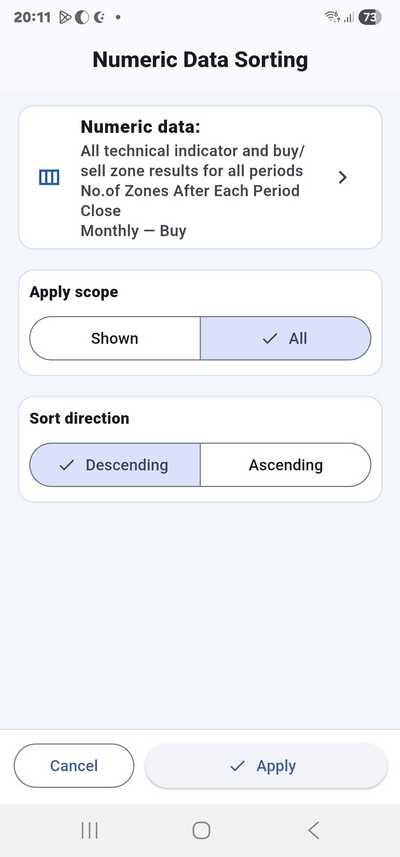
Displays the Custom Ranking window, which provides wide, useful, and simplified options for ranking companies/currency pairs using all parts, data, and results of the app. The first part is “Numerical Data Ranking”, which opens an internal ranking window containing selectable numerical data that are available and permitted for ranking from the app’s Details screen. These options are distributed across three lists: Main Data, Technical Indicator Analysis Results and Buy/Sell Zones for all periods, and Technical Indicator Data. Ranking can be performed in ascending or descending order, and can be applied either to the currently displayed instruments, meaning the visible stocks/currency pairs, or to all instruments after making the selection. The second part provides wide, useful, and simplified ranking options for companies/currency pairs using all parts and data of the app that cannot be ranked directly from the visible app data. Ranking can also be performed in ascending or descending order, and can be applied either to the currently displayed instruments, meaning the visible stocks/currency pairs, or to all instruments after making the selection. These options are distributed under three main lists as follows:
- Positive ranking: ranks all stocks/currency pairs by positivity using more than ten criteria related to rise strength and positive numerical technical-analysis results for the instrument itself, other instruments, the general index in stock-market versions, and historical periods.
- Negative ranking: ranks all stocks/currency pairs by negativity using more than ten criteria related to drop strength and negative numerical technical-analysis results.
- By percentage difference in expected rise price.
- By percentage difference in expected drop price.
- By average liquidity for the latest day.
- By volume percentage for the latest three days.
- By price-fluctuation percentage for the latest three days.
- By closeness to breaking the current Buy Zone on the daily period after the latest daily close.
- By closeness to breaking the current Sell Zone on the daily period after the latest daily close.
- By closeness to breaking the current Buy Zone on the weekly period after the latest daily close.
- By closeness to breaking the current Sell Zone on the weekly period after the latest daily close.
- By closeness to breaking the current Buy Zone on the monthly period after the latest daily close.
- By closeness to breaking the current Sell Zone on the monthly period after the latest daily close.
- By closeness to breaking the current Buy Zone on the weekly period after the latest weekly close.
- By closeness to breaking the current Sell Zone on the weekly period after the latest weekly close.
- By closeness to breaking the current Buy Zone on the monthly period after the latest monthly close.
- By closeness to breaking the current Sell Zone on the monthly period after the latest monthly close.
- From positivity to negativity for the daily period.
- From positivity to negativity for the weekly period.
- From positivity to negativity for the monthly period.
- From positivity to negativity for all periods.
- From negativity to positivity for the daily period.
- From negativity to positivity for the weekly period.
- From negativity to positivity for the monthly period.
- From negativity to positivity for all periods.
- Bullish ranking according to the weekly-analysis program after the latest daily close.
- Bearish ranking according to the weekly-analysis program after the latest daily close.
- Bullish ranking according to the weekly-analysis program after the latest weekly close.
- Bearish ranking according to the weekly-analysis program after the latest weekly close.
- Bullish ranking according to the monthly-analysis program after the latest daily close.
- Bearish ranking according to the monthly-analysis program after the latest daily close.
- Bullish ranking according to the monthly-analysis program after the latest monthly close.
- Bearish ranking according to the monthly-analysis program after the latest monthly close.
Ranking choices may be increased automatically when their usefulness is proven.
(11) Comparison Button
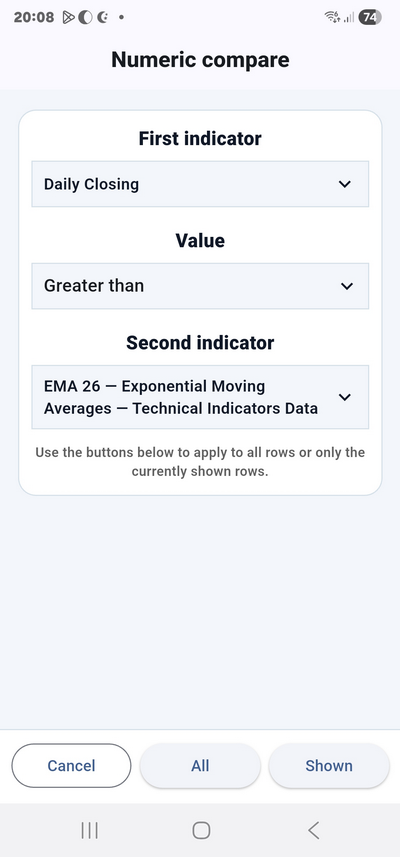
Displays the Numerical Comparison window, which allows comparison between comparable numerical values from the numerical data throughout the app. These fields include, but are not limited to:
- Close — Daily Close
- Low — Current Buy Zone — Buy/Sell Zone Details for the daily period after the latest daily close
- High — Current Buy Zone — Buy/Sell Zone Details for the daily period after the latest daily close
- High — Current Sell Zone — Buy/Sell Zone Details for the daily period after the latest daily close
- Low — Current Sell Zone — Buy/Sell Zone Details for the daily period after the latest daily close
- Low/High of current Buy and Sell Zones for weekly and monthly periods after the latest daily close
- Weekly close and Buy/Sell Zone fields after the latest weekly close
- Monthly close and Buy/Sell Zone fields after the latest monthly close
- UP, MID, and DOWN — Bollinger Bands — Technical Indicators Data
- Upper and Bottom — Price Channel — Technical Indicators Data
- DEMA and TEMA — DEMA & TEMA — Technical Indicators Data
- EMA 5, EMA 9, EMA 13, EMA 15, EMA 26, EMA 50, EMA 100 — Exponential Moving Averages — Technical Indicators Data
- P. SAR — Parabolic SAR — Technical Indicators Data
- LRI — Linear Regression Indicator — Technical Indicators Data
- UPB and LPB — Projection Bands — Technical Indicators Data
- UB and LB — Envelopes — Technical Indicators Data
- TSF — Time Series Forecast — Technical Indicators Data
(12) Search Icon
Searches stock/currency-pair names.
(13) Page Help Icon
Opens the help page for the current screen.
(14) Main App Menu Button
Displays the main app menu.