

Stock/Currency Pair Card
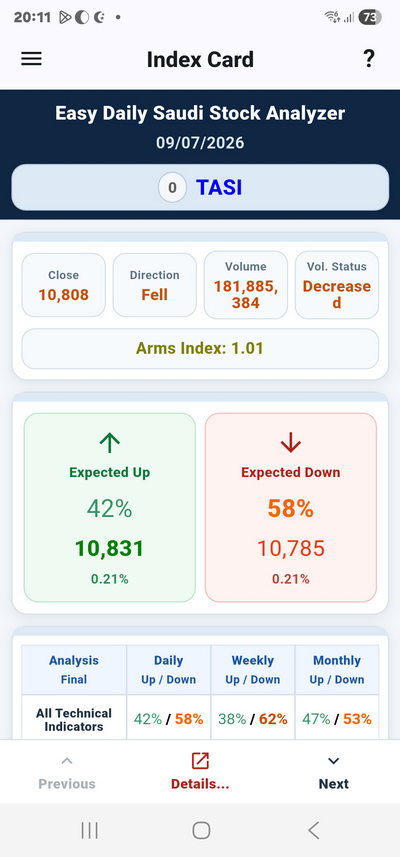
The Stock/Currency Pair Card appears when pressing a stock/currency-pair name or the general index. It contains the main information and important results for the selected company/currency pair, displays the most important technical-analysis results, expected price data, targets, supports, and resistances, and includes a simplified candlestick and volume chart for the latest five trading days.
The Card Contains the Following
(1) Market Name
Displays the market selected from the app Home Screen.
(2) Update Date
Shows the program data update date, which is the latest trading day and is intended for use on the following trading day. Stock-market data is updated after the close by at least five hours; Forex data is updated at 00:00 GMT. Update time may vary slightly based on market size, data availability, and corrections.
(3) Stock/Currency Pair Number and Name
Displays the stock/currency pair currently being shown. The number is the same serial number shown in the All Stocks/Currency Pairs List. The name color ranges from blue to black and indicates the expected upward price amount: the darker the color, the larger the expected upward price after automated analysis. The number color indicates list membership as follows:
- Light green: the stock/currency pair belongs to the “Bullish Favorites” list.
- Dark green: the stock/currency pair belongs to the “Top Bullish” list.
- Light red: the stock/currency pair belongs to the “Bearish Favorites” list.
- Dark red: the stock/currency pair belongs to the “Top Bearish” list.
- Gray: the stock/currency pair does not belong to any list.
(4) Close
Shows the close price for the latest trading day. The color indicates the close price state compared with the previous two closes:
- Olive: the close price rose compared with the previous close.
- Green: the close price is still rising compared with the previous two closes.
- Light brown: the close price fell compared with the previous close.
- Red: the close price is still falling compared with the previous two closes.
- Black: the close price did not change compared with the previous close.
(5) Close Direction
Shows the close-price direction compared with the previous two closes: Up, Rising, Down, Falling, or Unchanged, using the same color meanings.
(6) Volumes
Shows the traded volumes for the latest day. The color indicates the volume state compared with the previous two days: olive for increased, green for still increasing, light brown for decreased, red for still decreasing, and black for unchanged. Volume does not exist in Forex versions.
(7) Volumes State
Explains the volume state compared with the previous two days: Increased, Increasing, Decreased, Decreasing, or Unchanged. This field does not exist in Forex versions.
(8) ARMS INDEX
The ARMS INDEX is used to identify the market state for the latest period and appears only for the general index in stock-market versions:
- Dark green: less than 0.65 — Entry.
- Olive: 0.65 to 0.90 — Accumulation.
- Olive: 0.90 to 1.10 — Normal.
- Red: 1.10 to 1.35 — Distribution.
- Dark brown: greater than 1.35 — Exit.
- Dark brown: value (---) is outside the measurement range.
- ARMS INDEX does not exist in Forex data.
(9) Expected-Rise Percentage
Shows the final expected-rise percentage inferred from all effective technical indicators for the daily, weekly, and monthly periods. This percentage indicates the expectation of rise and not the amount of price movement. It is the same value shown in the Expected Rise column in the All Stocks/Currency Pairs List. It includes the effect of the general index and the rest of the instruments. Rise and drop are analyzed separately; therefore, their total does not necessarily equal 100%.
- Dark green: the rise percentage is greater than 80%.
- Green: the rise percentage is greater than 70%.
- Olive: the rise percentage is greater than 60%.
- Light green: the rise percentage is less than 60%.
- Wide light green: the rise percentage is greater than the drop percentage.
(10) Expected Price in Case of Rise
Shows the expected price in case of rise, which is the nearest price to calculated, corrective, historical resistance levels, Fibonacci levels, and EMA values, based on the average technical-indicator result. The darker the color, the harder the expected price is to exceed.
- Wide light green: the expected rise price is easy to exceed; it is an easy resistance.
- Light green: the expected rise price is easy to exceed; it is an easier resistance.
- Green: the expected rise price is difficult to exceed; it is a more difficult resistance.
- Dark green: the expected rise price is difficult to exceed; it is a strong resistance.
(11) Expected-Drop Percentage
Shows the final expected-drop percentage inferred from all effective technical indicators for the daily, weekly, and monthly periods. This percentage indicates the expectation of drop and not the exact amount of price movement. It is the same value shown in the Expected Drop column in the list screen. It includes general-index and cross-instrument effects, while rise and drop are analyzed separately.
- Maroon: the drop percentage is greater than 80%.
- Red: the drop percentage is greater than 70%.
- Light brown: the drop percentage is greater than 60%.
- Orange: the drop percentage is less than 60%.
- Wide orange: the drop percentage is greater than the rise percentage.
(12) Expected Price in Case of Drop
Shows the expected price in case of drop, which is the nearest price to calculated, corrective, historical support levels, Fibonacci levels, and EMA values based on the average technical-analysis result. The darker the color, the harder the expected price is to break.
- Wide orange: the expected drop price is easy to break; it is an easy support.
- Orange: the expected drop price is easy to break; it is an easier support.
- Red: the expected drop price is difficult to break; it is a more difficult support.
- Maroon: the expected drop price is difficult to break; it is a strong support.
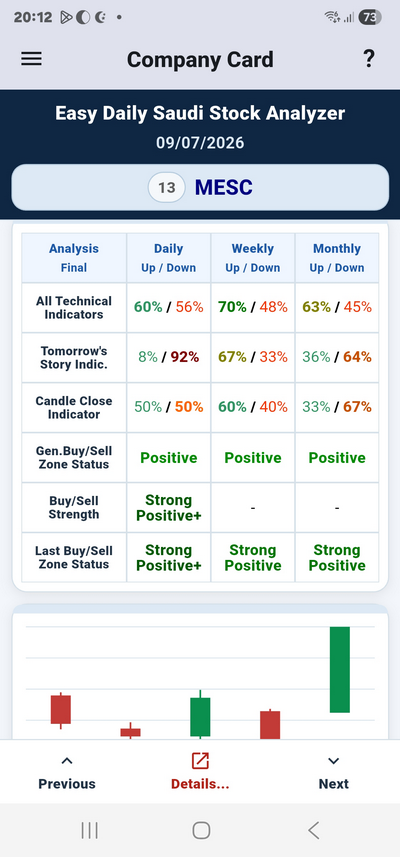
(13) Final Analysis Results
This section displays the most important numerical technical-analysis results for the company/currency pair for the daily, weekly, and monthly periods after the latest daily close.
Technical Indicators Analysis Result
The technical-indicators analysis result is the result of analyzing the effective technical indicators for each stock/currency pair from among the app indicators. It includes the effect of the general index and the effect of the rest of the instruments. Rise and drop are analyzed separately, and instruments are also compared with one another, so the percentages vary and their sum does not necessarily equal 100%.
Rise
Represents the expected-rise percentage.
- Dark green: the rise percentage is greater than 80%.
- Green: the rise percentage is greater than 70%.
- Olive: the rise percentage is greater than 60%.
- Light green: the rise percentage is less than 60%.
- Wide light green: the rise percentage is greater than the drop percentage.
Drop
Represents the expected-drop percentage.
- Maroon: the drop percentage is greater than 80%.
- Red: the drop percentage is greater than 70%.
- Light brown: the drop percentage is greater than 60%.
- Orange: the drop percentage is less than 60%.
- Wide orange: the drop percentage is greater than the rise percentage.
If the result is incomplete, the value appears as (–) in the rise and drop percentage fields.
Tomorrow’s Story Indicator Result
Tomorrow’s Story is a distinctive indicator that has proven high reliability in confirming signals. It shows the expected rise/drop state based on analyzing the behavior of only the latest trading period. It is very useful for confirming expected rise or drop, but should not be used alone without considering other indicators and data.
Candle-Close Indicator Result
Candle-Close is a distinctive indicator that has proven high reliability in confirming signals. It shows the expected rise/drop state based on numerical technical analysis of the close and state of the latest candle and a historical comparison with prior candle closes and states. It is useful for confirmation, but not as a standalone signal.
General Buy/Sell Zones State
Shows whether the Buy/Sell Zones, when analyzed together in general, are positive, negative, or indecisive, and shows the strength of positivity or negativity when available.
- Green: positive state.
- Red: negative state.
- Gray: indecisive state.
Buy/Sell Zones Strength
- Light green: Positive — indicates a Buy Zone.
- Green: Strong Positive — indicates a breakout above a previous Sell Zone.
- Dark green: Strong Positive+ — indicates a Buy Zone combined with a breakout above a previous Sell Zone.
- Red: Negative — indicates a Sell Zone.
- Brown: Strong Negative — indicates a breakdown below a previous Buy Zone.
- Dark brown: Strong Negative+ — indicates a Sell Zone combined with a breakdown below a previous Buy Zone.
Last Buy or Sell Zone State
- Light green: Positive.
- Green: Strong Positive.
- Dark green: Strong Positive+.
- Red: Negative.
- Brown: Strong Negative.
- Dark brown: Strong Negative+.
(14) A simplified chart
Displays a simplified candlestick and volume chart for the last 5 trading days.
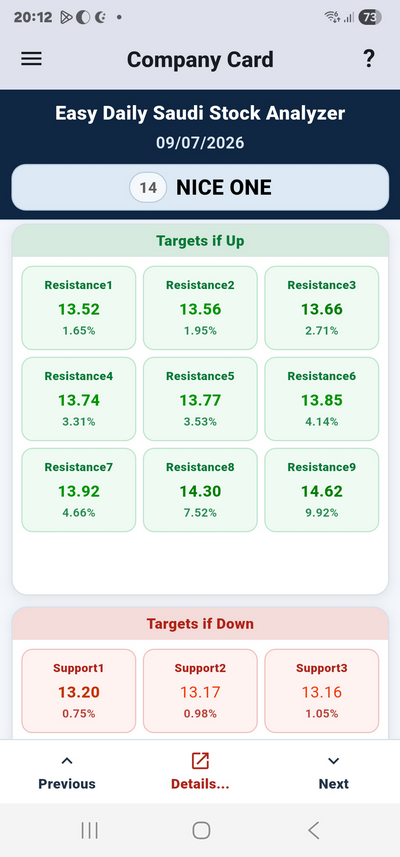
(15) Targets in Case of Rise
Contains the nine most important and strongest resistance points, merged from calculated, historical, corrective, Fibonacci, and EMA points in the program, including weekly and monthly resistance points. Green gradients indicate the strength of the point; darker colors mean stronger resistance.
(16) Targets in Case of Drop
Contains the nine most important and strongest support points, merged from calculated, historical, corrective, Fibonacci, and EMA points in the program, including weekly and monthly support points. Red and brown gradients indicate the strength of the point; darker colors mean stronger support.
(17) Loss-Limit / Stop-Loss
The strongest and nearest support price among calculated, corrective, historical, Fibonacci, or EMA levels, inferred according to technical-analysis results. It always appears in red.
(18) Next Button
Shows the next stock/currency pair according to the ranking of the instruments currently visible in the All Stocks/Currency Pairs List.
(19) Previous Button
Shows the previous stock/currency pair according to the ranking of the currently visible in the All Stocks/Currency Pairs List.
(20) Details Button
Opens the Details screen for the currently displayed stock/currency pair.
(21) Page Help Icon
Opens the help instructions for the current page.
(22) Main App Menu Button
Displays the main app menu.